
Advertisement
- Saudi Arabia
- /
- Gas Utilities
- /
- SASE:9516
Natural Gas Distribution (TADAWUL:9516) Is Finding It Tricky To Allocate Its Capital
What financial metrics can indicate to us that a company is maturing or even in decline? More often than not, we'll see a declining return on capital employed (ROCE) and a declining amount of capital employed. This reveals that the company isn't compounding shareholder wealth because returns are falling and its net asset base is shrinking. In light of that, from a first glance at Natural Gas Distribution (TADAWUL:9516), we've spotted some signs that it could be struggling, so let's investigate.
What Is Return On Capital Employed (ROCE)?
For those who don't know, ROCE is a measure of a company's yearly pre-tax profit (its return), relative to the capital employed in the business. To calculate this metric for Natural Gas Distribution, this is the formula:
Return on Capital Employed = Earnings Before Interest and Tax (EBIT) ÷ (Total Assets - Current Liabilities)
0.049 = ر.س3.1m ÷ (ر.س94m - ر.س29m) (Based on the trailing twelve months to December 2024).
Therefore, Natural Gas Distribution has an ROCE of 4.9%. In absolute terms, that's a low return and it also under-performs the Gas Utilities industry average of 7.9%.
See our latest analysis for Natural Gas Distribution
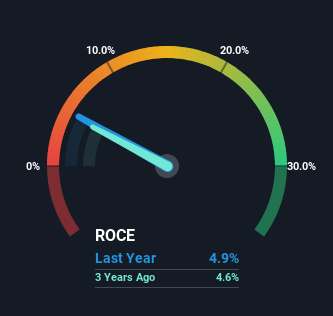
While the past is not representative of the future, it can be helpful to know how a company has performed historically, which is why we have this chart above. If you're interested in investigating Natural Gas Distribution's past further, check out this free graph covering Natural Gas Distribution's past earnings, revenue and cash flow.
The Trend Of ROCE
There is reason to be cautious about Natural Gas Distribution, given the returns are trending downwards. Unfortunately the returns on capital have diminished from the 7.5% that they were earning five years ago. And on the capital employed front, the business is utilizing roughly the same amount of capital as it was back then. Since returns are falling and the business has the same amount of assets employed, this can suggest it's a mature business that hasn't had much growth in the last five years. If these trends continue, we wouldn't expect Natural Gas Distribution to turn into a multi-bagger.
On a side note, Natural Gas Distribution's current liabilities have increased over the last five years to 31% of total assets, effectively distorting the ROCE to some degree. If current liabilities hadn't increased as much as they did, the ROCE could actually be even lower. Keep an eye on this ratio, because the business could encounter some new risks if this metric gets too high.
What We Can Learn From Natural Gas Distribution's ROCE
In summary, it's unfortunate that Natural Gas Distribution is generating lower returns from the same amount of capital. Investors haven't taken kindly to these developments, since the stock has declined 39% from where it was three years ago. That being the case, unless the underlying trends revert to a more positive trajectory, we'd consider looking elsewhere.
One more thing: We've identified 3 warning signs with Natural Gas Distribution (at least 1 which can't be ignored) , and understanding these would certainly be useful.
If you want to search for solid companies with great earnings, check out this free list of companies with good balance sheets and impressive returns on equity.
Valuation is complex, but we're here to simplify it.
Discover if Natural Gas Distribution might be undervalued or overvalued with our detailed analysis, featuring fair value estimates, potential risks, dividends, insider trades, and its financial condition.
Access Free AnalysisHave feedback on this article? Concerned about the content? Get in touch with us directly. Alternatively, email editorial-team (at) simplywallst.com.
This article by Simply Wall St is general in nature. We provide commentary based on historical data and analyst forecasts only using an unbiased methodology and our articles are not intended to be financial advice. It does not constitute a recommendation to buy or sell any stock, and does not take account of your objectives, or your financial situation. We aim to bring you long-term focused analysis driven by fundamental data. Note that our analysis may not factor in the latest price-sensitive company announcements or qualitative material. Simply Wall St has no position in any stocks mentioned.
About SASE:9516
Natural Gas Distribution
Distributes natural gas through pipelines in Saudi Arabia.
Flawless balance sheet with proven track record.
Market Insights

Advertisement
Community Narratives
MicroVision will explode future revenue by 380.37% with a vision towards success
Fair Value US$60|98.4% undervalued
TH
Community Contributor
The Indispensable Artery for a New North American Economy
Fair Value CA$132.87|0.8% undervalued
TI
Community Contributor
Recently Updated Narratives
RE

RecMag on Proximus ·
Proximus: The State-Backed Backup Plan with 7% Gross Yield and 15% Currency Upside.
Fair Value:€17.1359.3% undervalued
29 followersusers have followed this narrative
0 commentsusers have commented on this narrative
0 likesusers have liked this narrative
SW

swift11 on DXC Technology ·
CEO: We are winners in the long term in the AI world
Fair Value:US$17.4624.9% undervalued
1 followerusers have followed this narrative
0 commentsusers have commented on this narrative
0 likesusers have liked this narrative
AL

AlexLovell on Rocket Lab ·
Early mover in a fast growing industry. Likely to experience share price volatility as they scale
Fair Value:US$16.25158.0% overvalued
2 followersusers have followed this narrative
0 commentsusers have commented on this narrative
0 likesusers have liked this narrative
Popular Narratives
TH

TheWallstreetKing on MicroVision ·
MicroVision will explode future revenue by 380.37% with a vision towards success
Fair Value:US$6098.4% undervalued
99 followersusers have followed this narrative
10 commentsusers have commented on this narrative
19 likesusers have liked this narrative
OS


oscargarcia on Alphabet ·
The company that turned a verb into a global necessity and basically runs the modern internet, digital ads, smartphones, maps, and AI.
Fair Value:US$3405.9% undervalued
137 followersusers have followed this narrative
6 commentsusers have commented on this narrative
18 likesusers have liked this narrative
AN


AnalystConsensusTarget on NVIDIA ·
NVDA: Expanding AI Demand Will Drive Major Data Center Investments Through 2026
Fair Value:US$232.7922.6% undervalued
929 followersusers have followed this narrative
6 commentsusers have commented on this narrative
22 likesusers have liked this narrative