
Advertisement
- Saudi Arabia
- /
- Telecom Services and Carriers
- /
- SASE:7040
Etihad Atheeb Telecommunication Company's (TADAWUL:7040) Shares Leap 31% Yet They're Still Not Telling The Full Story
Those holding Etihad Atheeb Telecommunication Company (TADAWUL:7040) shares would be relieved that the share price has rebounded 31% in the last thirty days, but it needs to keep going to repair the recent damage it has caused to investor portfolios. Looking back a bit further, it's encouraging to see the stock is up 85% in the last year.
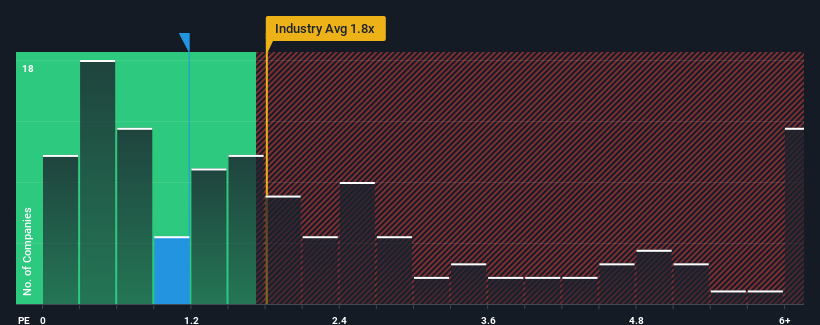
Although its price has surged higher, Etihad Atheeb Telecommunication's price-to-sales (or "P/S") ratio of 1.2x might still make it look like a buy right now compared to the Telecom industry in Saudi Arabia, where around half of the companies have P/S ratios above 1.8x and even P/S above 4x are quite common. Nonetheless, we'd need to dig a little deeper to determine if there is a rational basis for the reduced P/S.
View our latest analysis for Etihad Atheeb Telecommunication
How Etihad Atheeb Telecommunication Has Been Performing
Etihad Atheeb Telecommunication certainly has been doing a great job lately as it's been growing its revenue at a really rapid pace. One possibility is that the P/S ratio is low because investors think this strong revenue growth might actually underperform the broader industry in the near future. Those who are bullish on Etihad Atheeb Telecommunication will be hoping that this isn't the case, so that they can pick up the stock at a lower valuation.
We don't have analyst forecasts, but you can see how recent trends are setting up the company for the future by checking out our free report on Etihad Atheeb Telecommunication's earnings, revenue and cash flow.What Are Revenue Growth Metrics Telling Us About The Low P/S?
In order to justify its P/S ratio, Etihad Atheeb Telecommunication would need to produce sluggish growth that's trailing the industry.
Retrospectively, the last year delivered an exceptional 55% gain to the company's top line. The strong recent performance means it was also able to grow revenue by 210% in total over the last three years. Therefore, it's fair to say the revenue growth recently has been superb for the company.
When compared to the industry's one-year growth forecast of 5.2%, the most recent medium-term revenue trajectory is noticeably more alluring
With this information, we find it odd that Etihad Atheeb Telecommunication is trading at a P/S lower than the industry. Apparently some shareholders believe the recent performance has exceeded its limits and have been accepting significantly lower selling prices.
The Key Takeaway
Despite Etihad Atheeb Telecommunication's share price climbing recently, its P/S still lags most other companies. We'd say the price-to-sales ratio's power isn't primarily as a valuation instrument but rather to gauge current investor sentiment and future expectations.
Our examination of Etihad Atheeb Telecommunication revealed its three-year revenue trends aren't boosting its P/S anywhere near as much as we would have predicted, given they look better than current industry expectations. When we see robust revenue growth that outpaces the industry, we presume that there are notable underlying risks to the company's future performance, which is exerting downward pressure on the P/S ratio. While recent revenue trends over the past medium-term suggest that the risk of a price decline is low, investors appear to perceive a likelihood of revenue fluctuations in the future.
Having said that, be aware Etihad Atheeb Telecommunication is showing 2 warning signs in our investment analysis, you should know about.
If companies with solid past earnings growth is up your alley, you may wish to see this free collection of other companies with strong earnings growth and low P/E ratios.
Valuation is complex, but we're here to simplify it.
Discover if Etihad Atheeb Telecommunication might be undervalued or overvalued with our detailed analysis, featuring fair value estimates, potential risks, dividends, insider trades, and its financial condition.
Access Free AnalysisHave feedback on this article? Concerned about the content? Get in touch with us directly. Alternatively, email editorial-team (at) simplywallst.com.
This article by Simply Wall St is general in nature. We provide commentary based on historical data and analyst forecasts only using an unbiased methodology and our articles are not intended to be financial advice. It does not constitute a recommendation to buy or sell any stock, and does not take account of your objectives, or your financial situation. We aim to bring you long-term focused analysis driven by fundamental data. Note that our analysis may not factor in the latest price-sensitive company announcements or qualitative material. Simply Wall St has no position in any stocks mentioned.
About SASE:7040
Etihad Atheeb Telecommunication
Provides telecommunication products and services for individuals and businesses in the Kingdom of Saudi Arabia and internationally.
Excellent balance sheet with acceptable track record.
Market Insights

Advertisement
Community Narratives
The Next Phase of Energy Storage: How NeoVolta Is Tackling America’s Power Crunch
Fair Value US$7.50|35.1% undervalued
MA
Community Contributor
Why EnSilica is Worth Possibly 13x its Current Price
Fair Value UK£5.00|89.8% undervalued
DO
Community Contributor
M&A Activity, Industry Diversification & A Defense Contract Monopoly Will Push BWXT For Healthy Long-Term Growth
Fair Value US$220.00|15.2% undervalued
CL
Community Contributor
A case for Cassiar Gold Corp (TSXV: GLDC) to reach CAD$8-10 before 2030 (X30-37)
Fair Value CA$10.00|96.0% undervalued
AG
Community Contributor