- Saudi Arabia
- /
- Specialty Stores
- /
- SASE:4190
The past three years for Jarir Marketing (TADAWUL:4190) investors has not been profitable


In order to justify the effort of selecting individual stocks, it's worth striving to beat the returns from a market index fund. But in any portfolio, there are likely to be some stocks that fall short of that benchmark. Unfortunately, that's been the case for longer term Jarir Marketing Company (TADAWUL:4190) shareholders, since the share price is down 22% in the last three years, falling well short of the market return of around 32%.
Since shareholders are down over the longer term, lets look at the underlying fundamentals over the that time and see if they've been consistent with returns.
View our latest analysis for Jarir Marketing
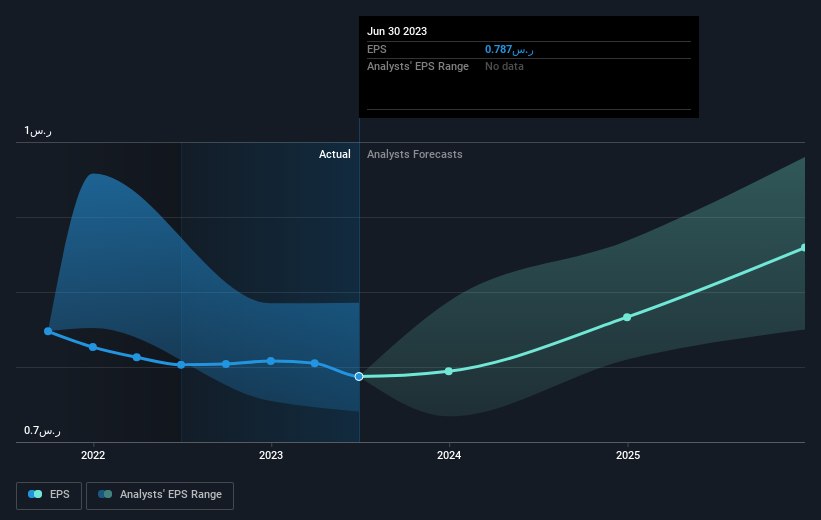
While markets are a powerful pricing mechanism, share prices reflect investor sentiment, not just underlying business performance. One way to examine how market sentiment has changed over time is to look at the interaction between a company's share price and its earnings per share (EPS).
During the three years that the share price fell, Jarir Marketing's earnings per share (EPS) dropped by 3.2% each year. This reduction in EPS is slower than the 8% annual reduction in the share price. So it seems the market was too confident about the business, in the past.
You can see below how EPS has changed over time (discover the exact values by clicking on the image).
Dive deeper into Jarir Marketing's key metrics by checking this interactive graph of Jarir Marketing's earnings, revenue and cash flow.
What About Dividends?
As well as measuring the share price return, investors should also consider the total shareholder return (TSR). Whereas the share price return only reflects the change in the share price, the TSR includes the value of dividends (assuming they were reinvested) and the benefit of any discounted capital raising or spin-off. It's fair to say that the TSR gives a more complete picture for stocks that pay a dividend. As it happens, Jarir Marketing's TSR for the last 3 years was -11%, which exceeds the share price return mentioned earlier. The dividends paid by the company have thusly boosted the total shareholder return.
A Different Perspective
Jarir Marketing shareholders are down 8.1% for the year (even including dividends), but the market itself is up 5.1%. Even the share prices of good stocks drop sometimes, but we want to see improvements in the fundamental metrics of a business, before getting too interested. On the bright side, long term shareholders have made money, with a gain of 4% per year over half a decade. If the fundamental data continues to indicate long term sustainable growth, the current sell-off could be an opportunity worth considering. While it is well worth considering the different impacts that market conditions can have on the share price, there are other factors that are even more important. Even so, be aware that Jarir Marketing is showing 1 warning sign in our investment analysis , you should know about...
Of course Jarir Marketing may not be the best stock to buy. So you may wish to see this free collection of growth stocks.
Please note, the market returns quoted in this article reflect the market weighted average returns of stocks that currently trade on Saudi exchanges.
If you're looking to trade Jarir Marketing, open an account with the lowest-cost platform trusted by professionals, Interactive Brokers.
With clients in over 200 countries and territories, and access to 160 markets, IBKR lets you trade stocks, options, futures, forex, bonds and funds from a single integrated account.
Enjoy no hidden fees, no account minimums, and FX conversion rates as low as 0.03%, far better than what most brokers offer.
Sponsored ContentNew: Manage All Your Stock Portfolios in One Place
We've created the ultimate portfolio companion for stock investors, and it's free.
• Connect an unlimited number of Portfolios and see your total in one currency
• Be alerted to new Warning Signs or Risks via email or mobile
• Track the Fair Value of your stocks
Have feedback on this article? Concerned about the content? Get in touch with us directly. Alternatively, email editorial-team (at) simplywallst.com.
This article by Simply Wall St is general in nature. We provide commentary based on historical data and analyst forecasts only using an unbiased methodology and our articles are not intended to be financial advice. It does not constitute a recommendation to buy or sell any stock, and does not take account of your objectives, or your financial situation. We aim to bring you long-term focused analysis driven by fundamental data. Note that our analysis may not factor in the latest price-sensitive company announcements or qualitative material. Simply Wall St has no position in any stocks mentioned.
About SASE:4190
Jarir Marketing
Engages in the retail and wholesale trading of office and school supplies in the Kingdom of Saudi Arabia, Egypt, and other Gulf countries.
Flawless balance sheet and fair value.
Market Insights

Community Narratives

