- Saudi Arabia
- /
- Chemicals
- /
- SASE:2330
Estimating The Fair Value Of Advanced Petrochemical Company (TADAWUL:2330)


Key Insights
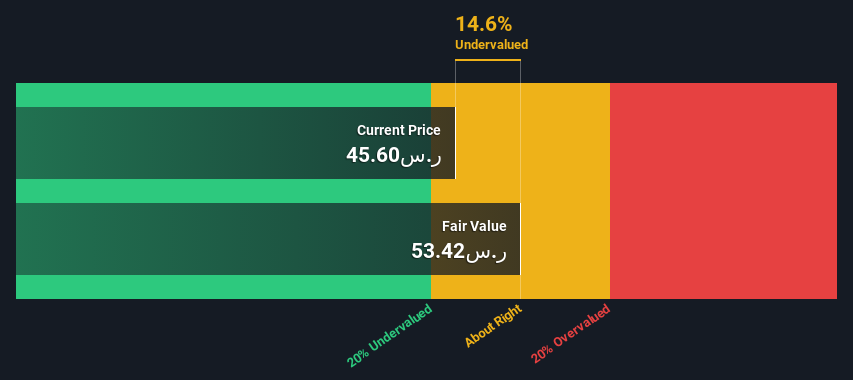
- Advanced Petrochemical's estimated fair value is ر.س53.42 based on 2 Stage Free Cash Flow to Equity
- Advanced Petrochemical's ر.س45.60 share price indicates it is trading at similar levels as its fair value estimate
- The ر.س45.63 analyst price target for 2330 is 15% less than our estimate of fair value
How far off is Advanced Petrochemical Company (TADAWUL:2330) from its intrinsic value? Using the most recent financial data, we'll take a look at whether the stock is fairly priced by estimating the company's future cash flows and discounting them to their present value. One way to achieve this is by employing the Discounted Cash Flow (DCF) model. It may sound complicated, but actually it is quite simple!
We generally believe that a company's value is the present value of all of the cash it will generate in the future. However, a DCF is just one valuation metric among many, and it is not without flaws. If you want to learn more about discounted cash flow, the rationale behind this calculation can be read in detail in the Simply Wall St analysis model.
Check out our latest analysis for Advanced Petrochemical
The Calculation
We're using the 2-stage growth model, which simply means we take in account two stages of company's growth. In the initial period the company may have a higher growth rate and the second stage is usually assumed to have a stable growth rate. To begin with, we have to get estimates of the next ten years of cash flows. Where possible we use analyst estimates, but when these aren't available we extrapolate the previous free cash flow (FCF) from the last estimate or reported value. We assume companies with shrinking free cash flow will slow their rate of shrinkage, and that companies with growing free cash flow will see their growth rate slow, over this period. We do this to reflect that growth tends to slow more in the early years than it does in later years.
Generally we assume that a dollar today is more valuable than a dollar in the future, and so the sum of these future cash flows is then discounted to today's value:
10-year free cash flow (FCF) forecast
| 2024 | 2025 | 2026 | 2027 | 2028 | 2029 | 2030 | 2031 | 2032 | 2033 | |
| Levered FCF (SAR, Millions) | -ر.س912.0m | ر.س1.33b | ر.س1.68b | ر.س1.75b | ر.س1.84b | ر.س1.96b | ر.س2.10b | ر.س2.27b | ر.س2.45b | ر.س2.66b |
| Growth Rate Estimate Source | Analyst x3 | Analyst x2 | Analyst x2 | Analyst x2 | Est @ 5.43% | Est @ 6.50% | Est @ 7.24% | Est @ 7.77% | Est @ 8.13% | Est @ 8.39% |
| Present Value (SAR, Millions) Discounted @ 17% | -ر.س780 | ر.س972 | ر.س1.0k | ر.س933 | ر.س841 | ر.س765 | ر.س701 | ر.س646 | ر.س597 | ر.س553 |
("Est" = FCF growth rate estimated by Simply Wall St)
Present Value of 10-year Cash Flow (PVCF) = ر.س6.3b
The second stage is also known as Terminal Value, this is the business's cash flow after the first stage. For a number of reasons a very conservative growth rate is used that cannot exceed that of a country's GDP growth. In this case we have used the 5-year average of the 10-year government bond yield (9.0%) to estimate future growth. In the same way as with the 10-year 'growth' period, we discount future cash flows to today's value, using a cost of equity of 17%.
Terminal Value (TV)= FCF2033 × (1 + g) ÷ (r – g) = ر.س2.7b× (1 + 9.0%) ÷ (17%– 9.0%) = ر.س36b
Present Value of Terminal Value (PVTV)= TV / (1 + r)10= ر.س36b÷ ( 1 + 17%)10= ر.س7.5b
The total value, or equity value, is then the sum of the present value of the future cash flows, which in this case is ر.س14b. To get the intrinsic value per share, we divide this by the total number of shares outstanding. Compared to the current share price of ر.س45.6, the company appears about fair value at a 15% discount to where the stock price trades currently. The assumptions in any calculation have a big impact on the valuation, so it is better to view this as a rough estimate, not precise down to the last cent.
Important Assumptions
We would point out that the most important inputs to a discounted cash flow are the discount rate and of course the actual cash flows. You don't have to agree with these inputs, I recommend redoing the calculations yourself and playing with them. The DCF also does not consider the possible cyclicality of an industry, or a company's future capital requirements, so it does not give a full picture of a company's potential performance. Given that we are looking at Advanced Petrochemical as potential shareholders, the cost of equity is used as the discount rate, rather than the cost of capital (or weighted average cost of capital, WACC) which accounts for debt. In this calculation we've used 17%, which is based on a levered beta of 1.118. Beta is a measure of a stock's volatility, compared to the market as a whole. We get our beta from the industry average beta of globally comparable companies, with an imposed limit between 0.8 and 2.0, which is a reasonable range for a stable business.
SWOT Analysis for Advanced Petrochemical
- Debt is well covered by earnings.
- Dividend is in the top 25% of dividend payers in the market.
- Earnings declined over the past year.
- Annual earnings are forecast to grow faster than the Saudi market.
- Current share price is below our estimate of fair value.
- Debt is not well covered by operating cash flow.
- Dividends are not covered by earnings.
Looking Ahead:
Whilst important, the DCF calculation is only one of many factors that you need to assess for a company. DCF models are not the be-all and end-all of investment valuation. Rather it should be seen as a guide to "what assumptions need to be true for this stock to be under/overvalued?" For example, changes in the company's cost of equity or the risk free rate can significantly impact the valuation. For Advanced Petrochemical, we've put together three essential factors you should consider:
- Risks: For example, we've discovered 4 warning signs for Advanced Petrochemical (3 are significant!) that you should be aware of before investing here.
- Future Earnings: How does 2330's growth rate compare to its peers and the wider market? Dig deeper into the analyst consensus number for the upcoming years by interacting with our free analyst growth expectation chart.
- Other High Quality Alternatives: Do you like a good all-rounder? Explore our interactive list of high quality stocks to get an idea of what else is out there you may be missing!
PS. The Simply Wall St app conducts a discounted cash flow valuation for every stock on the SASE every day. If you want to find the calculation for other stocks just search here.
New: Manage All Your Stock Portfolios in One Place
We've created the ultimate portfolio companion for stock investors, and it's free.
• Connect an unlimited number of Portfolios and see your total in one currency
• Be alerted to new Warning Signs or Risks via email or mobile
• Track the Fair Value of your stocks
Have feedback on this article? Concerned about the content? Get in touch with us directly. Alternatively, email editorial-team (at) simplywallst.com.
This article by Simply Wall St is general in nature. We provide commentary based on historical data and analyst forecasts only using an unbiased methodology and our articles are not intended to be financial advice. It does not constitute a recommendation to buy or sell any stock, and does not take account of your objectives, or your financial situation. We aim to bring you long-term focused analysis driven by fundamental data. Note that our analysis may not factor in the latest price-sensitive company announcements or qualitative material. Simply Wall St has no position in any stocks mentioned.
About SASE:2330
Advanced Petrochemical
Engages in the production and sale of propylene, polypropylene, isopropyl alcohol, polysilicon, and polysilicon downstream products in the Kingdom of Saudi Arabia and internationally.
Exceptional growth potential average dividend payer.
Market Insights

Community Narratives

