- Saudi Arabia
- /
- Basic Materials
- /
- SASE:2090
National Gypsum Company's (TADAWUL:2090) Stock Is Rallying But Financials Look Ambiguous: Will The Momentum Continue?

National Gypsum's (TADAWUL:2090) stock is up by a considerable 8.2% over the past month. But the company's key financial indicators appear to be differing across the board and that makes us question whether or not the company's current share price momentum can be maintained. Particularly, we will be paying attention to National Gypsum's ROE today.
Return on Equity or ROE is a test of how effectively a company is growing its value and managing investors’ money. Put another way, it reveals the company's success at turning shareholder investments into profits.
Check out our latest analysis for National Gypsum
How To Calculate Return On Equity?
The formula for return on equity is:
Return on Equity = Net Profit (from continuing operations) ÷ Shareholders' Equity
So, based on the above formula, the ROE for National Gypsum is:
8.9% = ر.س42m ÷ ر.س466m (Based on the trailing twelve months to September 2020).
The 'return' refers to a company's earnings over the last year. Another way to think of that is that for every SAR1 worth of equity, the company was able to earn SAR0.09 in profit.
What Is The Relationship Between ROE And Earnings Growth?
We have already established that ROE serves as an efficient profit-generating gauge for a company's future earnings. Based on how much of its profits the company chooses to reinvest or "retain", we are then able to evaluate a company's future ability to generate profits. Assuming all else is equal, companies that have both a higher return on equity and higher profit retention are usually the ones that have a higher growth rate when compared to companies that don't have the same features.
National Gypsum's Earnings Growth And 8.9% ROE
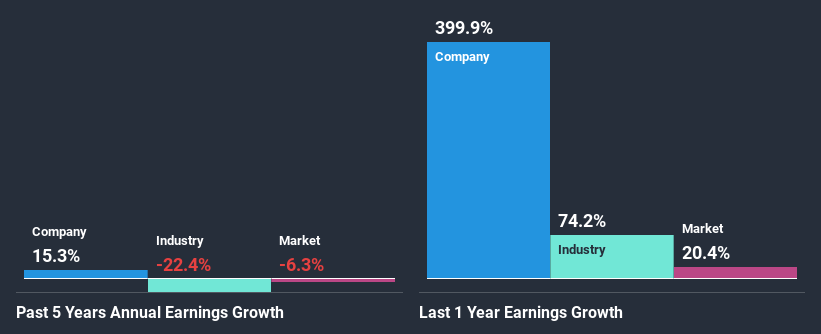
As you can see, National Gypsum's ROE looks pretty weak. A comparison with the industry shows that the company's ROE is pretty similar to the average industry ROE of 9.1%. As a result, National Gypsum's decent 15% net income growth seen over the past five years bodes well with us. Considering the low ROE, it is quite possible that there might also be some other aspects that are positively influencing the company's earnings growth. For example, it is possible that the company's management has made some good strategic decisions, or that the company has a low payout ratio.
Next, on comparing with the industry net income growth, we found that the growth figure reported by National Gypsum compares quite favourably to the industry average, which shows a decline of 22% in the same period.

The basis for attaching value to a company is, to a great extent, tied to its earnings growth. What investors need to determine next is if the expected earnings growth, or the lack of it, is already built into the share price. By doing so, they will have an idea if the stock is headed into clear blue waters or if swampy waters await. Is National Gypsum fairly valued compared to other companies? These 3 valuation measures might help you decide.
Is National Gypsum Efficiently Re-investing Its Profits?
National Gypsum's high three-year median payout ratio of 106% suggests that the company is paying out more to its shareholders than what it is making. Still the company's earnings have grown respectably. That being said, the high payout ratio could be worth keeping an eye on in case the company is unable to keep up its current growth momentum.
Moreover, National Gypsum is determined to keep sharing its profits with shareholders which we infer from its long history of paying a dividend for at least ten years.
Summary
On the whole, we feel that the performance shown by National Gypsum can be open to many interpretations. While the company has posted impressive earnings growth, its poor ROE and low earnings retention makes us doubtful if that growth could continue, if by any chance the business is faced with any sort of risk. Until now, we have only just grazed the surface of the company's past performance by looking at the company's fundamentals. You can do your own research on National Gypsum and see how it has performed in the past by looking at this FREE detailed graph of past earnings, revenue and cash flows.
If you decide to trade National Gypsum, use the lowest-cost* platform that is rated #1 Overall by Barron’s, Interactive Brokers. Trade stocks, options, futures, forex, bonds and funds on 135 markets, all from a single integrated account. Promoted
Valuation is complex, but we're here to simplify it.
Discover if National Gypsum might be undervalued or overvalued with our detailed analysis, featuring fair value estimates, potential risks, dividends, insider trades, and its financial condition.
Access Free AnalysisThis article by Simply Wall St is general in nature. It does not constitute a recommendation to buy or sell any stock, and does not take account of your objectives, or your financial situation. We aim to bring you long-term focused analysis driven by fundamental data. Note that our analysis may not factor in the latest price-sensitive company announcements or qualitative material. Simply Wall St has no position in any stocks mentioned.
*Interactive Brokers Rated Lowest Cost Broker by StockBrokers.com Annual Online Review 2020
Have feedback on this article? Concerned about the content? Get in touch with us directly. Alternatively, email editorial-team (at) simplywallst.com.
About SASE:2090
National Gypsum
Engages in the manufacture and trading of gypsum and its derivatives in the Kingdom of Saudi Arabia.
Flawless balance sheet minimal.
Similar Companies
Market Insights
Community Narratives


