Stock Analysis
- Saudi Arabia
- /
- Chemicals
- /
- SASE:2010
Is Saudi Basic Industries Corporation (TADAWUL:2010) Expensive For A Reason? A Look At Its Intrinsic Value

Key Insights
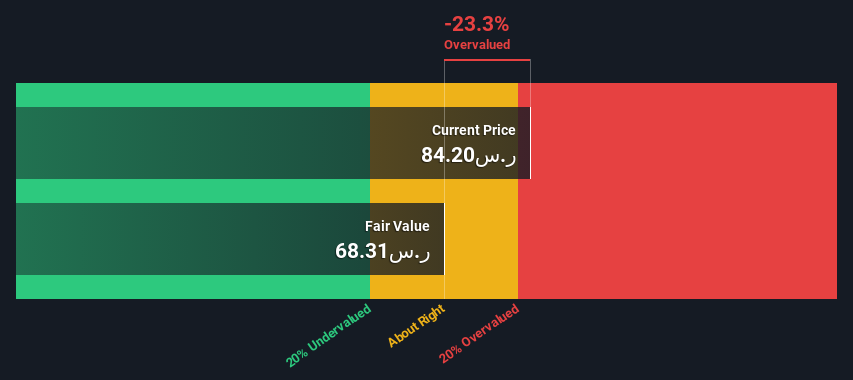
- Saudi Basic Industries' estimated fair value is ر.س68.31 based on 2 Stage Free Cash Flow to Equity
- Saudi Basic Industries' ر.س84.20 share price signals that it might be 23% overvalued
- Analyst price target for 2010 is ر.س101, which is 47% above our fair value estimate
Today we'll do a simple run through of a valuation method used to estimate the attractiveness of Saudi Basic Industries Corporation (TADAWUL:2010) as an investment opportunity by taking the expected future cash flows and discounting them to today's value. One way to achieve this is by employing the Discounted Cash Flow (DCF) model. Don't get put off by the jargon, the math behind it is actually quite straightforward.
We would caution that there are many ways of valuing a company and, like the DCF, each technique has advantages and disadvantages in certain scenarios. If you still have some burning questions about this type of valuation, take a look at the Simply Wall St analysis model.
View our latest analysis for Saudi Basic Industries
The Method
We use what is known as a 2-stage model, which simply means we have two different periods of growth rates for the company's cash flows. Generally the first stage is higher growth, and the second stage is a lower growth phase. To start off with, we need to estimate the next ten years of cash flows. Where possible we use analyst estimates, but when these aren't available we extrapolate the previous free cash flow (FCF) from the last estimate or reported value. We assume companies with shrinking free cash flow will slow their rate of shrinkage, and that companies with growing free cash flow will see their growth rate slow, over this period. We do this to reflect that growth tends to slow more in the early years than it does in later years.
A DCF is all about the idea that a dollar in the future is less valuable than a dollar today, so we need to discount the sum of these future cash flows to arrive at a present value estimate:
10-year free cash flow (FCF) forecast
| 2024 | 2025 | 2026 | 2027 | 2028 | 2029 | 2030 | 2031 | 2032 | 2033 | |
| Levered FCF (SAR, Millions) | ر.س18.3b | ر.س19.8b | ر.س24.9b | ر.س23.1b | ر.س22.5b | ر.س22.8b | ر.س23.6b | ر.س24.8b | ر.س26.3b | ر.س28.2b |
| Growth Rate Estimate Source | Analyst x4 | Analyst x3 | Analyst x2 | Analyst x1 | Est @ -2.31% | Est @ 1.08% | Est @ 3.45% | Est @ 5.11% | Est @ 6.28% | Est @ 7.09% |
| Present Value (SAR, Millions) Discounted @ 16% | ر.س15.7k | ر.س14.7k | ر.س15.9k | ر.س12.7k | ر.س10.7k | ر.س9.3k | ر.س8.3k | ر.س7.5k | ر.س6.9k | ر.س6.3k |
("Est" = FCF growth rate estimated by Simply Wall St)
Present Value of 10-year Cash Flow (PVCF) = ر.س108b
We now need to calculate the Terminal Value, which accounts for all the future cash flows after this ten year period. The Gordon Growth formula is used to calculate Terminal Value at a future annual growth rate equal to the 5-year average of the 10-year government bond yield of 9.0%. We discount the terminal cash flows to today's value at a cost of equity of 16%.
Terminal Value (TV)= FCF2033 × (1 + g) ÷ (r – g) = ر.س28b× (1 + 9.0%) ÷ (16%– 9.0%) = ر.س432b
Present Value of Terminal Value (PVTV)= TV / (1 + r)10= ر.س432b÷ ( 1 + 16%)10= ر.س97b
The total value, or equity value, is then the sum of the present value of the future cash flows, which in this case is ر.س205b. To get the intrinsic value per share, we divide this by the total number of shares outstanding. Relative to the current share price of ر.س84.2, the company appears slightly overvalued at the time of writing. Valuations are imprecise instruments though, rather like a telescope - move a few degrees and end up in a different galaxy. Do keep this in mind.
Important Assumptions
We would point out that the most important inputs to a discounted cash flow are the discount rate and of course the actual cash flows. Part of investing is coming up with your own evaluation of a company's future performance, so try the calculation yourself and check your own assumptions. The DCF also does not consider the possible cyclicality of an industry, or a company's future capital requirements, so it does not give a full picture of a company's potential performance. Given that we are looking at Saudi Basic Industries as potential shareholders, the cost of equity is used as the discount rate, rather than the cost of capital (or weighted average cost of capital, WACC) which accounts for debt. In this calculation we've used 16%, which is based on a levered beta of 0.995. Beta is a measure of a stock's volatility, compared to the market as a whole. We get our beta from the industry average beta of globally comparable companies, with an imposed limit between 0.8 and 2.0, which is a reasonable range for a stable business.
SWOT Analysis for Saudi Basic Industries
- Debt is not viewed as a risk.
- Dividend is in the top 25% of dividend payers in the market.
- Earnings declined over the past year.
- Annual earnings are forecast to grow faster than the Saudi market.
- Good value based on P/E ratio compared to estimated Fair P/E ratio.
- Dividends are not covered by earnings.
- Revenue is forecast to grow slower than 20% per year.
Moving On:
Whilst important, the DCF calculation is only one of many factors that you need to assess for a company. The DCF model is not a perfect stock valuation tool. Instead the best use for a DCF model is to test certain assumptions and theories to see if they would lead to the company being undervalued or overvalued. If a company grows at a different rate, or if its cost of equity or risk free rate changes sharply, the output can look very different. What is the reason for the share price exceeding the intrinsic value? For Saudi Basic Industries, there are three essential items you should assess:
- Risks: Be aware that Saudi Basic Industries is showing 2 warning signs in our investment analysis , you should know about...
- Future Earnings: How does 2010's growth rate compare to its peers and the wider market? Dig deeper into the analyst consensus number for the upcoming years by interacting with our free analyst growth expectation chart.
- Other Solid Businesses: Low debt, high returns on equity and good past performance are fundamental to a strong business. Why not explore our interactive list of stocks with solid business fundamentals to see if there are other companies you may not have considered!
PS. The Simply Wall St app conducts a discounted cash flow valuation for every stock on the SASE every day. If you want to find the calculation for other stocks just search here.
Valuation is complex, but we're helping make it simple.
Find out whether Saudi Basic Industries is potentially over or undervalued by checking out our comprehensive analysis, which includes fair value estimates, risks and warnings, dividends, insider transactions and financial health.
View the Free AnalysisHave feedback on this article? Concerned about the content? Get in touch with us directly. Alternatively, email editorial-team (at) simplywallst.com.
This article by Simply Wall St is general in nature. We provide commentary based on historical data and analyst forecasts only using an unbiased methodology and our articles are not intended to be financial advice. It does not constitute a recommendation to buy or sell any stock, and does not take account of your objectives, or your financial situation. We aim to bring you long-term focused analysis driven by fundamental data. Note that our analysis may not factor in the latest price-sensitive company announcements or qualitative material. Simply Wall St has no position in any stocks mentioned.

Simply Wall St
About SASE:2010
Saudi Basic Industries
Saudi Basic Industries Corporation engages in the manufacture, marketing, and distribution of chemicals, polymers, plastics, agri-nutrients, and metal products worldwide.
Flawless balance sheet and good value.
