
Advertisement
- Saudi Arabia
- /
- Insurance
- /
- SASE:8311
Saudi Enaya Cooperative Insurance Company (TADAWUL:8311) Looks Just Right With A 35% Price Jump

Saudi Enaya Cooperative Insurance Company (TADAWUL:8311) shares have continued their recent momentum with a 35% gain in the last month alone. The annual gain comes to 127% following the latest surge, making investors sit up and take notice.
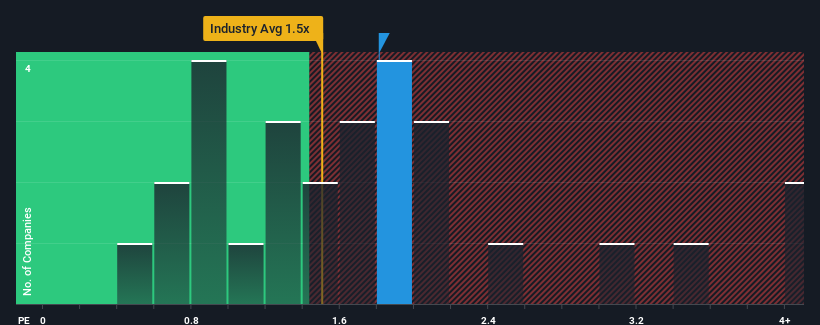
In spite of the firm bounce in price, there still wouldn't be many who think Saudi Enaya Cooperative Insurance's price-to-sales (or "P/S") ratio of 1.8x is worth a mention when the median P/S in Saudi Arabia's Insurance industry is similar at about 1.5x. While this might not raise any eyebrows, if the P/S ratio is not justified investors could be missing out on a potential opportunity or ignoring looming disappointment.
See our latest analysis for Saudi Enaya Cooperative Insurance
How Saudi Enaya Cooperative Insurance Has Been Performing
The revenue growth achieved at Saudi Enaya Cooperative Insurance over the last year would be more than acceptable for most companies. It might be that many expect the respectable revenue performance to wane, which has kept the P/S from rising. Those who are bullish on Saudi Enaya Cooperative Insurance will be hoping that this isn't the case, so that they can pick up the stock at a lower valuation.
Want the full picture on earnings, revenue and cash flow for the company? Then our free report on Saudi Enaya Cooperative Insurance will help you shine a light on its historical performance.How Is Saudi Enaya Cooperative Insurance's Revenue Growth Trending?
In order to justify its P/S ratio, Saudi Enaya Cooperative Insurance would need to produce growth that's similar to the industry.
Taking a look back first, we see that the company grew revenue by an impressive 21% last year. Pleasingly, revenue has also lifted 61% in aggregate from three years ago, thanks to the last 12 months of growth. Therefore, it's fair to say the revenue growth recently has been superb for the company.
It's interesting to note that the rest of the industry is similarly expected to grow by 17% over the next year, which is fairly even with the company's recent medium-term annualised growth rates.
With this information, we can see why Saudi Enaya Cooperative Insurance is trading at a fairly similar P/S to the industry. Apparently shareholders are comfortable to simply hold on assuming the company will continue keeping a low profile.
What We Can Learn From Saudi Enaya Cooperative Insurance's P/S?
Saudi Enaya Cooperative Insurance appears to be back in favour with a solid price jump bringing its P/S back in line with other companies in the industry While the price-to-sales ratio shouldn't be the defining factor in whether you buy a stock or not, it's quite a capable barometer of revenue expectations.
As we've seen, Saudi Enaya Cooperative Insurance's three-year revenue trends seem to be contributing to its P/S, given they look similar to current industry expectations. Currently, with a past revenue trend that aligns closely wit the industry outlook, shareholders are confident the company's future revenue outlook won't contain any major surprises. If recent medium-term revenue trends continue, it's hard to see the share price moving strongly in either direction in the near future under these circumstances.
The company's balance sheet is another key area for risk analysis. You can assess many of the main risks through our free balance sheet analysis for Saudi Enaya Cooperative Insurance with six simple checks.
If these risks are making you reconsider your opinion on Saudi Enaya Cooperative Insurance, explore our interactive list of high quality stocks to get an idea of what else is out there.
New: Manage All Your Stock Portfolios in One Place
We've created the ultimate portfolio companion for stock investors, and it's free.
• Connect an unlimited number of Portfolios and see your total in one currency
• Be alerted to new Warning Signs or Risks via email or mobile
• Track the Fair Value of your stocks
Have feedback on this article? Concerned about the content? Get in touch with us directly. Alternatively, email editorial-team (at) simplywallst.com.
This article by Simply Wall St is general in nature. We provide commentary based on historical data and analyst forecasts only using an unbiased methodology and our articles are not intended to be financial advice. It does not constitute a recommendation to buy or sell any stock, and does not take account of your objectives, or your financial situation. We aim to bring you long-term focused analysis driven by fundamental data. Note that our analysis may not factor in the latest price-sensitive company announcements or qualitative material. Simply Wall St has no position in any stocks mentioned.
About SASE:8311
Saudi Enaya Cooperative Insurance
Provides health insurance services to individuals and businesses in the Kingdom of Saudi Arabia.
Adequate balance sheet and overvalued.
Market Insights

Advertisement
Community Narratives

BMW cruising ahead with new EVs and premium models to boost revenue 5%
Fair Value €135.07|44.6% undervalued
UN
Community Contributor
EU#2 - From Humble Beginnings to Global Powerhouse
Fair Value DKK 851.04|46.4% undervalued
TO
Community Contributor