- Saudi Arabia
- /
- Healthcare Services
- /
- SASE:2140
More Unpleasant Surprises Could Be In Store For Ayyan Investment Company's (TADAWUL:2140) Shares After Tumbling 29%


The Ayyan Investment Company (TADAWUL:2140) share price has softened a substantial 29% over the previous 30 days, handing back much of the gains the stock has made lately. Still, a bad month hasn't completely ruined the past year with the stock gaining 28%, which is great even in a bull market.
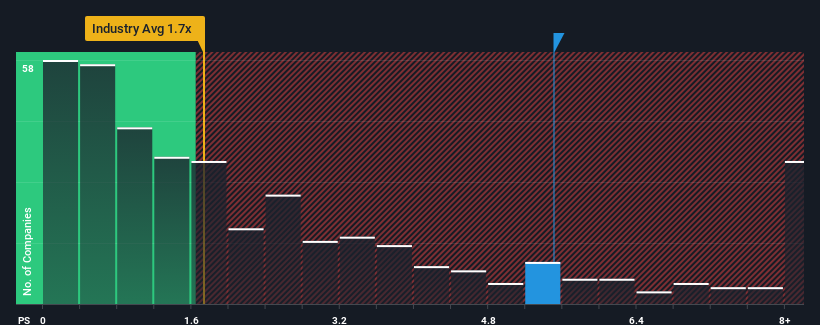
Even after such a large drop in price, it's still not a stretch to say that Ayyan Investment's price-to-sales (or "P/S") ratio of 5.5x right now seems quite "middle-of-the-road" compared to the Healthcare industry in Saudi Arabia, seeing as it matches the P/S ratio of the wider industry. While this might not raise any eyebrows, if the P/S ratio is not justified investors could be missing out on a potential opportunity or ignoring looming disappointment.
View our latest analysis for Ayyan Investment
What Does Ayyan Investment's P/S Mean For Shareholders?
The revenue growth achieved at Ayyan Investment over the last year would be more than acceptable for most companies. It might be that many expect the respectable revenue performance to wane, which has kept the P/S from rising. If that doesn't eventuate, then existing shareholders probably aren't too pessimistic about the future direction of the share price.
We don't have analyst forecasts, but you can see how recent trends are setting up the company for the future by checking out our free report on Ayyan Investment's earnings, revenue and cash flow.How Is Ayyan Investment's Revenue Growth Trending?
There's an inherent assumption that a company should be matching the industry for P/S ratios like Ayyan Investment's to be considered reasonable.
If we review the last year of revenue growth, the company posted a worthy increase of 9.5%. Revenue has also lifted 14% in aggregate from three years ago, partly thanks to the last 12 months of growth. So we can start by confirming that the company has actually done a good job of growing revenue over that time.
Comparing that to the industry, which is predicted to deliver 21% growth in the next 12 months, the company's momentum is weaker, based on recent medium-term annualised revenue results.
In light of this, it's curious that Ayyan Investment's P/S sits in line with the majority of other companies. It seems most investors are ignoring the fairly limited recent growth rates and are willing to pay up for exposure to the stock. Maintaining these prices will be difficult to achieve as a continuation of recent revenue trends is likely to weigh down the shares eventually.
The Bottom Line On Ayyan Investment's P/S
With its share price dropping off a cliff, the P/S for Ayyan Investment looks to be in line with the rest of the Healthcare industry. It's argued the price-to-sales ratio is an inferior measure of value within certain industries, but it can be a powerful business sentiment indicator.
Our examination of Ayyan Investment revealed its poor three-year revenue trends aren't resulting in a lower P/S as per our expectations, given they look worse than current industry outlook. Right now we are uncomfortable with the P/S as this revenue performance isn't likely to support a more positive sentiment for long. Unless the recent medium-term conditions improve, it's hard to accept the current share price as fair value.
We don't want to rain on the parade too much, but we did also find 3 warning signs for Ayyan Investment that you need to be mindful of.
If companies with solid past earnings growth is up your alley, you may wish to see this free collection of other companies with strong earnings growth and low P/E ratios.
New: Manage All Your Stock Portfolios in One Place
We've created the ultimate portfolio companion for stock investors, and it's free.
• Connect an unlimited number of Portfolios and see your total in one currency
• Be alerted to new Warning Signs or Risks via email or mobile
• Track the Fair Value of your stocks
Have feedback on this article? Concerned about the content? Get in touch with us directly. Alternatively, email editorial-team (at) simplywallst.com.
This article by Simply Wall St is general in nature. We provide commentary based on historical data and analyst forecasts only using an unbiased methodology and our articles are not intended to be financial advice. It does not constitute a recommendation to buy or sell any stock, and does not take account of your objectives, or your financial situation. We aim to bring you long-term focused analysis driven by fundamental data. Note that our analysis may not factor in the latest price-sensitive company announcements or qualitative material. Simply Wall St has no position in any stocks mentioned.
About SASE:2140
Adequate balance sheet low.

