- Saudi Arabia
- /
- Hospitality
- /
- SASE:1810
These Return Metrics Don't Make Seera Holding Group (TADAWUL:1810) Look Too Strong

Ignoring the stock price of a company, what are the underlying trends that tell us a business is past the growth phase? When we see a declining return on capital employed (ROCE) in conjunction with a declining base of capital employed, that's often how a mature business shows signs of aging. Ultimately this means that the company is earning less per dollar invested and on top of that, it's shrinking its base of capital employed. In light of that, from a first glance at Seera Holding Group (TADAWUL:1810), we've spotted some signs that it could be struggling, so let's investigate.
What Is Return On Capital Employed (ROCE)?
For those who don't know, ROCE is a measure of a company's yearly pre-tax profit (its return), relative to the capital employed in the business. The formula for this calculation on Seera Holding Group is:
Return on Capital Employed = Earnings Before Interest and Tax (EBIT) ÷ (Total Assets - Current Liabilities)
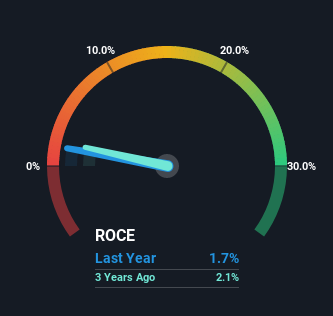
0.017 = ر.س111m ÷ (ر.س8.8b - ر.س2.2b) (Based on the trailing twelve months to March 2023).
Thus, Seera Holding Group has an ROCE of 1.7%. In absolute terms, that's a low return and it also under-performs the Hospitality industry average of 5.8%.
View our latest analysis for Seera Holding Group
In the above chart we have measured Seera Holding Group's prior ROCE against its prior performance, but the future is arguably more important. If you're interested, you can view the analysts predictions in our free report on analyst forecasts for the company.
SWOT Analysis for Seera Holding Group
- Currently debt free.
- Expensive based on P/E ratio and estimated fair value.
- Shareholders have been diluted in the past year.
- Annual earnings are forecast to grow faster than the Saudi market.
- Revenue is forecast to grow slower than 20% per year.
So How Is Seera Holding Group's ROCE Trending?
In terms of Seera Holding Group's historical ROCE movements, the trend doesn't inspire confidence. Unfortunately the returns on capital have diminished from the 11% that they were earning five years ago. And on the capital employed front, the business is utilizing roughly the same amount of capital as it was back then. This combination can be indicative of a mature business that still has areas to deploy capital, but the returns received aren't as high due potentially to new competition or smaller margins. So because these trends aren't typically conducive to creating a multi-bagger, we wouldn't hold our breath on Seera Holding Group becoming one if things continue as they have.
What We Can Learn From Seera Holding Group's ROCE
All in all, the lower returns from the same amount of capital employed aren't exactly signs of a compounding machine. Investors must expect better things on the horizon though because the stock has risen 37% in the last five years. Either way, we aren't huge fans of the current trends and so with that we think you might find better investments elsewhere.
Seera Holding Group does have some risks though, and we've spotted 2 warning signs for Seera Holding Group that you might be interested in.
If you want to search for solid companies with great earnings, check out this free list of companies with good balance sheets and impressive returns on equity.
The New Payments ETF Is Live on NASDAQ:
Money is moving to real-time rails, and a newly listed ETF now gives investors direct exposure. Fast settlement. Institutional custody. Simple access.
Explore how this launch could reshape portfolios
Sponsored ContentNew: Manage All Your Stock Portfolios in One Place
We've created the ultimate portfolio companion for stock investors, and it's free.
• Connect an unlimited number of Portfolios and see your total in one currency
• Be alerted to new Warning Signs or Risks via email or mobile
• Track the Fair Value of your stocks
Have feedback on this article? Concerned about the content? Get in touch with us directly. Alternatively, email editorial-team (at) simplywallst.com.
This article by Simply Wall St is general in nature. We provide commentary based on historical data and analyst forecasts only using an unbiased methodology and our articles are not intended to be financial advice. It does not constitute a recommendation to buy or sell any stock, and does not take account of your objectives, or your financial situation. We aim to bring you long-term focused analysis driven by fundamental data. Note that our analysis may not factor in the latest price-sensitive company announcements or qualitative material. Simply Wall St has no position in any stocks mentioned.
About SASE:1810
Seera Holding Group
Provides travel and tourism services in the Kingdom of Saudi Arabia, the United Kingdom, Egypt, the United Arab Emirates, Spain, and Kuwait.
Reasonable growth potential and fair value.
Market Insights

Weekly Picks

Early mover in a fast growing industry. Likely to experience share price volatility as they scale


A case for CA$31.80 (undiluted), aka 8,616% upside from CA$0.37 (an 86 bagger!).


Moderation and Stabilisation: HOLD: Fair Price based on a 4-year Cycle is $12.08
Recently Updated Narratives


Positioned to Win as the Streaming Wars Settle

Meta’s Bold Bet on AI Pays Off

ADP Stock: Solid Fundamentals, But AI Investments Test Its Margin Resilience
Popular Narratives


Crazy Undervalued 42 Baggers Silver Play (Active & Running Mine)


NVDA: Expanding AI Demand Will Drive Major Data Center Investments Through 2026

The AI Infrastructure Giant Grows Into Its Valuation
Trending Discussion

