- Saudi Arabia
- /
- Food and Staples Retail
- /
- SASE:4006
Estimating The Intrinsic Value Of Saudi Marketing Company (TADAWUL:4006)


Key Insights
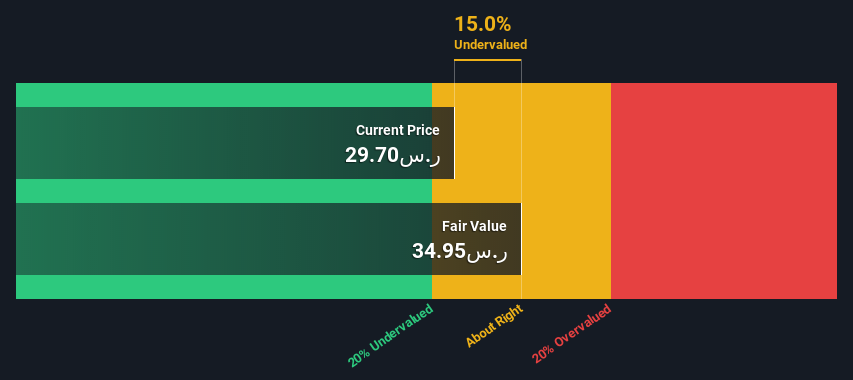
- The projected fair value for Saudi Marketing is ر.س34.95 based on 2 Stage Free Cash Flow to Equity
- Saudi Marketing's ر.س29.70 share price indicates it is trading at similar levels as its fair value estimate
- Peers of Saudi Marketing are currently trading on average at a 28% premium
How far off is Saudi Marketing Company (TADAWUL:4006) from its intrinsic value? Using the most recent financial data, we'll take a look at whether the stock is fairly priced by taking the forecast future cash flows of the company and discounting them back to today's value. This will be done using the Discounted Cash Flow (DCF) model. Don't get put off by the jargon, the math behind it is actually quite straightforward.
Companies can be valued in a lot of ways, so we would point out that a DCF is not perfect for every situation. For those who are keen learners of equity analysis, the Simply Wall St analysis model here may be something of interest to you.
Check out our latest analysis for Saudi Marketing
The Model
We're using the 2-stage growth model, which simply means we take in account two stages of company's growth. In the initial period the company may have a higher growth rate and the second stage is usually assumed to have a stable growth rate. In the first stage we need to estimate the cash flows to the business over the next ten years. Seeing as no analyst estimates of free cash flow are available to us, we have extrapolate the previous free cash flow (FCF) from the company's last reported value. We assume companies with shrinking free cash flow will slow their rate of shrinkage, and that companies with growing free cash flow will see their growth rate slow, over this period. We do this to reflect that growth tends to slow more in the early years than it does in later years.
Generally we assume that a dollar today is more valuable than a dollar in the future, so we need to discount the sum of these future cash flows to arrive at a present value estimate:
10-year free cash flow (FCF) estimate
| 2023 | 2024 | 2025 | 2026 | 2027 | 2028 | 2029 | 2030 | 2031 | 2032 | |
| Levered FCF (SAR, Millions) | ر.س116.8m | ر.س125.7m | ر.س135.8m | ر.س147.1m | ر.س159.6m | ر.س173.4m | ر.س188.6m | ر.س205.2m | ر.س223.5m | ر.س243.4m |
| Growth Rate Estimate Source | Est @ 7.02% | Est @ 7.61% | Est @ 8.02% | Est @ 8.31% | Est @ 8.52% | Est @ 8.66% | Est @ 8.76% | Est @ 8.83% | Est @ 8.88% | Est @ 8.91% |
| Present Value (SAR, Millions) Discounted @ 16% | ر.س101 | ر.س93.1 | ر.س86.6 | ر.س80.7 | ر.س75.4 | ر.س70.6 | ر.س66.0 | ر.س61.9 | ر.س58.0 | ر.س54.4 |
("Est" = FCF growth rate estimated by Simply Wall St)
Present Value of 10-year Cash Flow (PVCF) = ر.س747m
After calculating the present value of future cash flows in the initial 10-year period, we need to calculate the Terminal Value, which accounts for all future cash flows beyond the first stage. For a number of reasons a very conservative growth rate is used that cannot exceed that of a country's GDP growth. In this case we have used the 5-year average of the 10-year government bond yield (9.0%) to estimate future growth. In the same way as with the 10-year 'growth' period, we discount future cash flows to today's value, using a cost of equity of 16%.
Terminal Value (TV)= FCF2032 × (1 + g) ÷ (r – g) = ر.س243m× (1 + 9.0%) ÷ (16%– 9.0%) = ر.س3.7b
Present Value of Terminal Value (PVTV)= TV / (1 + r)10= ر.س3.7b÷ ( 1 + 16%)10= ر.س825m
The total value is the sum of cash flows for the next ten years plus the discounted terminal value, which results in the Total Equity Value, which in this case is ر.س1.6b. The last step is to then divide the equity value by the number of shares outstanding. Relative to the current share price of ر.س29.7, the company appears about fair value at a 15% discount to where the stock price trades currently. The assumptions in any calculation have a big impact on the valuation, so it is better to view this as a rough estimate, not precise down to the last cent.
The Assumptions
The calculation above is very dependent on two assumptions. The first is the discount rate and the other is the cash flows. Part of investing is coming up with your own evaluation of a company's future performance, so try the calculation yourself and check your own assumptions. The DCF also does not consider the possible cyclicality of an industry, or a company's future capital requirements, so it does not give a full picture of a company's potential performance. Given that we are looking at Saudi Marketing as potential shareholders, the cost of equity is used as the discount rate, rather than the cost of capital (or weighted average cost of capital, WACC) which accounts for debt. In this calculation we've used 16%, which is based on a levered beta of 1.003. Beta is a measure of a stock's volatility, compared to the market as a whole. We get our beta from the industry average beta of globally comparable companies, with an imposed limit between 0.8 and 2.0, which is a reasonable range for a stable business.
SWOT Analysis for Saudi Marketing
- Debt is well covered by cash flow.
- Earnings growth over the past year underperformed the Consumer Retailing industry.
- Interest payments on debt are not well covered.
- Dividend is low compared to the top 25% of dividend payers in the Consumer Retailing market.
- Current share price is below our estimate of fair value.
- Lack of analyst coverage makes it difficult to determine 4006's earnings prospects.
- Dividends are not covered by earnings.
Moving On:
Valuation is only one side of the coin in terms of building your investment thesis, and it is only one of many factors that you need to assess for a company. DCF models are not the be-all and end-all of investment valuation. Preferably you'd apply different cases and assumptions and see how they would impact the company's valuation. For example, changes in the company's cost of equity or the risk free rate can significantly impact the valuation. For Saudi Marketing, there are three further aspects you should assess:
- Risks: Case in point, we've spotted 2 warning signs for Saudi Marketing you should be aware of, and 1 of them can't be ignored.
- Other Solid Businesses: Low debt, high returns on equity and good past performance are fundamental to a strong business. Why not explore our interactive list of stocks with solid business fundamentals to see if there are other companies you may not have considered!
- Other Top Analyst Picks: Interested to see what the analysts are thinking? Take a look at our interactive list of analysts' top stock picks to find out what they feel might have an attractive future outlook!
PS. Simply Wall St updates its DCF calculation for every Saudi stock every day, so if you want to find the intrinsic value of any other stock just search here.
New: Manage All Your Stock Portfolios in One Place
We've created the ultimate portfolio companion for stock investors, and it's free.
• Connect an unlimited number of Portfolios and see your total in one currency
• Be alerted to new Warning Signs or Risks via email or mobile
• Track the Fair Value of your stocks
Have feedback on this article? Concerned about the content? Get in touch with us directly. Alternatively, email editorial-team (at) simplywallst.com.
This article by Simply Wall St is general in nature. We provide commentary based on historical data and analyst forecasts only using an unbiased methodology and our articles are not intended to be financial advice. It does not constitute a recommendation to buy or sell any stock, and does not take account of your objectives, or your financial situation. We aim to bring you long-term focused analysis driven by fundamental data. Note that our analysis may not factor in the latest price-sensitive company announcements or qualitative material. Simply Wall St has no position in any stocks mentioned.
About SASE:4006
Saudi Marketing
Engages in the retail, trading, and importing business in the Kingdom of Saudi Arabia.
Reasonable growth potential with adequate balance sheet.
Similar Companies
Market Insights

Community Narratives

