- Saudi Arabia
- /
- Luxury
- /
- SASE:4012
Is Thob Al Aseel Company's (TADAWUL:4012) Stock On A Downtrend As A Result Of Its Poor Financials?


With its stock down 20% over the past three months, it is easy to disregard Thob Al Aseel (TADAWUL:4012). To decide if this trend could continue, we decided to look at its weak fundamentals as they shape the long-term market trends. Specifically, we decided to study Thob Al Aseel's ROE in this article.
Return on equity or ROE is a key measure used to assess how efficiently a company's management is utilizing the company's capital. In other words, it is a profitability ratio which measures the rate of return on the capital provided by the company's shareholders.
See our latest analysis for Thob Al Aseel
How To Calculate Return On Equity?
The formula for return on equity is:
Return on Equity = Net Profit (from continuing operations) ÷ Shareholders' Equity
So, based on the above formula, the ROE for Thob Al Aseel is:
12% = ر.س70m ÷ ر.س603m (Based on the trailing twelve months to June 2023).
The 'return' refers to a company's earnings over the last year. That means that for every SAR1 worth of shareholders' equity, the company generated SAR0.12 in profit.
What Is The Relationship Between ROE And Earnings Growth?
So far, we've learned that ROE is a measure of a company's profitability. We now need to evaluate how much profit the company reinvests or "retains" for future growth which then gives us an idea about the growth potential of the company. Assuming all else is equal, companies that have both a higher return on equity and higher profit retention are usually the ones that have a higher growth rate when compared to companies that don't have the same features.
A Side By Side comparison of Thob Al Aseel's Earnings Growth And 12% ROE
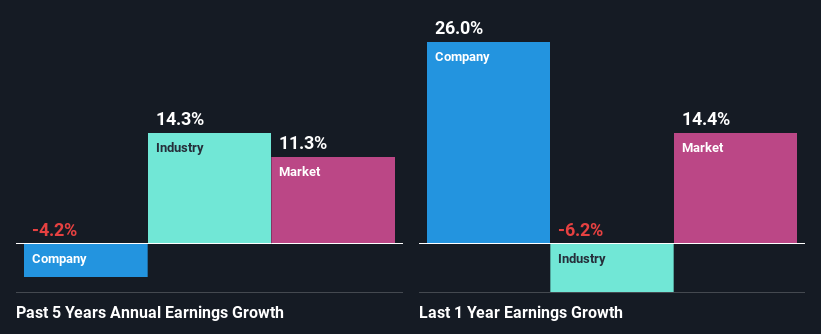
At first glance, Thob Al Aseel's ROE doesn't look very promising. Although a closer study shows that the company's ROE is higher than the industry average of 7.4% which we definitely can't overlook. But then again, seeing that Thob Al Aseel's net income shrunk at a rate of 4.2% in the past five years, makes us think again. Bear in mind, the company does have a slightly low ROE. It is just that the industry ROE is lower. Therefore, the decline in earnings could also be the result of this.
So, as a next step, we compared Thob Al Aseel's performance against the industry and were disappointed to discover that while the company has been shrinking its earnings, the industry has been growing its earnings at a rate of 14% over the last few years.
Earnings growth is a huge factor in stock valuation. It’s important for an investor to know whether the market has priced in the company's expected earnings growth (or decline). By doing so, they will have an idea if the stock is headed into clear blue waters or if swampy waters await. One good indicator of expected earnings growth is the P/E ratio which determines the price the market is willing to pay for a stock based on its earnings prospects. So, you may want to check if Thob Al Aseel is trading on a high P/E or a low P/E, relative to its industry.
Is Thob Al Aseel Efficiently Re-investing Its Profits?
With a high three-year median payout ratio of 96% (implying that 3.6% of the profits are retained), most of Thob Al Aseel's profits are being paid to shareholders, which explains the company's shrinking earnings. With only a little being reinvested into the business, earnings growth would obviously be low or non-existent. You can see the 2 risks we have identified for Thob Al Aseel by visiting our risks dashboard for free on our platform here.
In addition, Thob Al Aseel has been paying dividends over a period of six years suggesting that keeping up dividend payments is preferred by the management even though earnings have been in decline.
Summary
On the whole, Thob Al Aseel's performance is quite a big let-down. While its ROE is pretty moderate, the company is retaining very little of its profits, meaning very little of its profits are being reinvested into the business. This explains the lack or absence of growth in its earnings. Until now, we have only just grazed the surface of the company's past performance by looking at the company's fundamentals. So it may be worth checking this free detailed graph of Thob Al Aseel's past earnings, as well as revenue and cash flows to get a deeper insight into the company's performance.
If you're looking to trade Thob Al Aseel, open an account with the lowest-cost platform trusted by professionals, Interactive Brokers.
With clients in over 200 countries and territories, and access to 160 markets, IBKR lets you trade stocks, options, futures, forex, bonds and funds from a single integrated account.
Enjoy no hidden fees, no account minimums, and FX conversion rates as low as 0.03%, far better than what most brokers offer.
Sponsored ContentValuation is complex, but we're here to simplify it.
Discover if Thob Al Aseel might be undervalued or overvalued with our detailed analysis, featuring fair value estimates, potential risks, dividends, insider trades, and its financial condition.
Access Free AnalysisHave feedback on this article? Concerned about the content? Get in touch with us directly. Alternatively, email editorial-team (at) simplywallst.com.
This article by Simply Wall St is general in nature. We provide commentary based on historical data and analyst forecasts only using an unbiased methodology and our articles are not intended to be financial advice. It does not constitute a recommendation to buy or sell any stock, and does not take account of your objectives, or your financial situation. We aim to bring you long-term focused analysis driven by fundamental data. Note that our analysis may not factor in the latest price-sensitive company announcements or qualitative material. Simply Wall St has no position in any stocks mentioned.
About SASE:4012
Thob Al Aseel
Develops, imports, exports, wholesales, and retails fabrics and readymade clothes.
Flawless balance sheet with proven track record.
Market Insights

Community Narratives

