- Saudi Arabia
- /
- Consumer Durables
- /
- SASE:1213
How Much Did Naseej International Trading's (TADAWUL:1213) Shareholders Earn On Their Investment Over The Last Five Years?


It is a pleasure to report that the Naseej International Trading Co. (TADAWUL:1213) is up 96% in the last quarter. But if you look at the last five years the returns have not been good. After all, the share price is down 58% in that time, significantly under-performing the market.
Check out our latest analysis for Naseej International Trading
Naseej International Trading isn't currently profitable, so most analysts would look to revenue growth to get an idea of how fast the underlying business is growing. Shareholders of unprofitable companies usually expect strong revenue growth. Some companies are willing to postpone profitability to grow revenue faster, but in that case one does expect good top-line growth.
In the last five years Naseej International Trading saw its revenue shrink by 27% per year. That puts it in an unattractive cohort, to put it mildly. It seems appropriate, then, that the share price slid about 10% annually during that time. We don't generally like to own companies that lose money and don't grow revenues. You might be better off spending your money on a leisure activity. You'd want to research this company pretty thoroughly before buying, it looks a bit too risky for us.
The graphic below depicts how earnings and revenue have changed over time (unveil the exact values by clicking on the image).
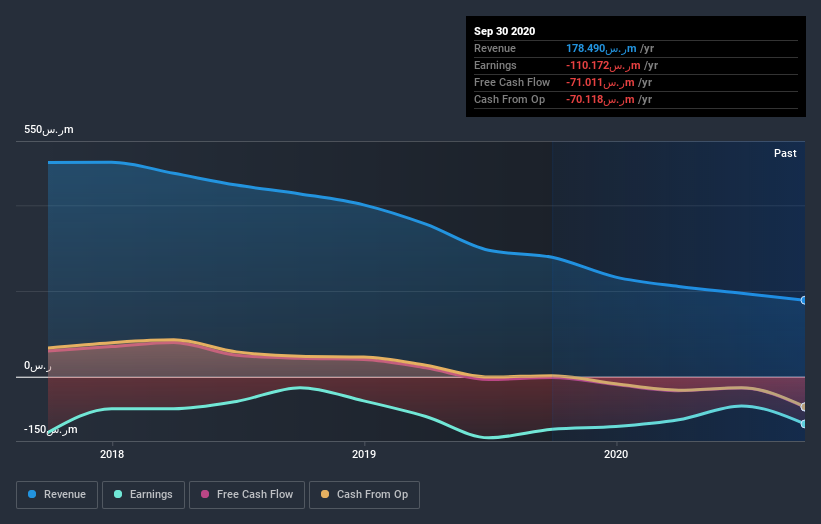
Balance sheet strength is crucial. It might be well worthwhile taking a look at our free report on how its financial position has changed over time.
What about the Total Shareholder Return (TSR)?
Investors should note that there's a difference between Naseej International Trading's total shareholder return (TSR) and its share price change, which we've covered above. Arguably the TSR is a more complete return calculation because it accounts for the value of dividends (as if they were reinvested), along with the hypothetical value of any discounted capital that have been offered to shareholders. Naseej International Trading hasn't been paying dividends, but its TSR of -24% exceeds its share price return of -58%, implying it has either spun-off a business, or raised capital at a discount; thereby providing additional value to shareholders.
A Different Perspective
We're pleased to report that Naseej International Trading shareholders have received a total shareholder return of 120% over one year. There's no doubt those recent returns are much better than the TSR loss of 4% per year over five years. The long term loss makes us cautious, but the short term TSR gain certainly hints at a brighter future. I find it very interesting to look at share price over the long term as a proxy for business performance. But to truly gain insight, we need to consider other information, too. For instance, we've identified 4 warning signs for Naseej International Trading (3 are concerning) that you should be aware of.
Of course Naseej International Trading may not be the best stock to buy. So you may wish to see this free collection of growth stocks.
Please note, the market returns quoted in this article reflect the market weighted average returns of stocks that currently trade on SA exchanges.
If you’re looking to trade Naseej International Trading, open an account with the lowest-cost* platform trusted by professionals, Interactive Brokers. Their clients from over 200 countries and territories trade stocks, options, futures, forex, bonds and funds worldwide from a single integrated account. Promoted
Valuation is complex, but we're here to simplify it.
Discover if Naseej International Trading might be undervalued or overvalued with our detailed analysis, featuring fair value estimates, potential risks, dividends, insider trades, and its financial condition.
Access Free AnalysisThis article by Simply Wall St is general in nature. It does not constitute a recommendation to buy or sell any stock, and does not take account of your objectives, or your financial situation. We aim to bring you long-term focused analysis driven by fundamental data. Note that our analysis may not factor in the latest price-sensitive company announcements or qualitative material. Simply Wall St has no position in any stocks mentioned.
*Interactive Brokers Rated Lowest Cost Broker by StockBrokers.com Annual Online Review 2020
Have feedback on this article? Concerned about the content? Get in touch with us directly. Alternatively, email editorial-team (at) simplywallst.com.
About SASE:1213
Naseej International Trading
Together with subsidiaries, engages in the manufacture, import, export, wholesale, and retailing of carpets and rugs in the Kingdom of Saudi Arabia.
Excellent balance sheet and overvalued.
Market Insights

Community Narratives

