- Saudi Arabia
- /
- Trade Distributors
- /
- SASE:9510
National Building and Marketing (TADAWUL:9510) Will Want To Turn Around Its Return Trends


If we want to find a potential multi-bagger, often there are underlying trends that can provide clues. In a perfect world, we'd like to see a company investing more capital into its business and ideally the returns earned from that capital are also increasing. Put simply, these types of businesses are compounding machines, meaning they are continually reinvesting their earnings at ever-higher rates of return. Having said that, from a first glance at National Building and Marketing (TADAWUL:9510) we aren't jumping out of our chairs at how returns are trending, but let's have a deeper look.
What Is Return On Capital Employed (ROCE)?
For those who don't know, ROCE is a measure of a company's yearly pre-tax profit (its return), relative to the capital employed in the business. To calculate this metric for National Building and Marketing, this is the formula:
Return on Capital Employed = Earnings Before Interest and Tax (EBIT) ÷ (Total Assets - Current Liabilities)
0.16 = ر.س64m ÷ (ر.س1.0b - ر.س607m) (Based on the trailing twelve months to December 2023).
Therefore, National Building and Marketing has an ROCE of 16%. In absolute terms, that's a satisfactory return, but compared to the Trade Distributors industry average of 7.2% it's much better.
Check out our latest analysis for National Building and Marketing
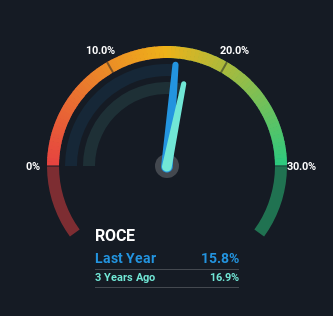
Historical performance is a great place to start when researching a stock so above you can see the gauge for National Building and Marketing's ROCE against it's prior returns. If you're interested in investigating National Building and Marketing's past further, check out this free graph covering National Building and Marketing's past earnings, revenue and cash flow.
How Are Returns Trending?
On the surface, the trend of ROCE at National Building and Marketing doesn't inspire confidence. Around five years ago the returns on capital were 22%, but since then they've fallen to 16%. Meanwhile, the business is utilizing more capital but this hasn't moved the needle much in terms of sales in the past 12 months, so this could reflect longer term investments. It may take some time before the company starts to see any change in earnings from these investments.
On a side note, National Building and Marketing's current liabilities have increased over the last five years to 60% of total assets, effectively distorting the ROCE to some degree. Without this increase, it's likely that ROCE would be even lower than 16%. And with current liabilities at these levels, suppliers or short-term creditors are effectively funding a large part of the business, which can introduce some risks.
What We Can Learn From National Building and Marketing's ROCE
In summary, National Building and Marketing is reinvesting funds back into the business for growth but unfortunately it looks like sales haven't increased much just yet. And in the last three years, the stock has given away 19% so the market doesn't look too hopeful on these trends strengthening any time soon. Therefore based on the analysis done in this article, we don't think National Building and Marketing has the makings of a multi-bagger.
If you'd like to know about the risks facing National Building and Marketing, we've discovered 3 warning signs that you should be aware of.
While National Building and Marketing may not currently earn the highest returns, we've compiled a list of companies that currently earn more than 25% return on equity. Check out this free list here.
Valuation is complex, but we're here to simplify it.
Discover if National Building and Marketing might be undervalued or overvalued with our detailed analysis, featuring fair value estimates, potential risks, dividends, insider trades, and its financial condition.
Access Free AnalysisHave feedback on this article? Concerned about the content? Get in touch with us directly. Alternatively, email editorial-team (at) simplywallst.com.
This article by Simply Wall St is general in nature. We provide commentary based on historical data and analyst forecasts only using an unbiased methodology and our articles are not intended to be financial advice. It does not constitute a recommendation to buy or sell any stock, and does not take account of your objectives, or your financial situation. We aim to bring you long-term focused analysis driven by fundamental data. Note that our analysis may not factor in the latest price-sensitive company announcements or qualitative material. Simply Wall St has no position in any stocks mentioned.
Have feedback on this article? Concerned about the content? Get in touch with us directly. Alternatively, email editorial-team@simplywallst.com
About SASE:9510
National Building and Marketing
Engages in the wholesale and retail of construction materials in the Kingdom of Saudi Arabia.
Slight with mediocre balance sheet.
Market Insights

Community Narratives

