- Saudi Arabia
- /
- Building
- /
- SASE:4141
Al-Omran Industrial Trading (TADAWUL:4141) delivers shareholders massive 32% CAGR over 5 years, surging 10% in the last week alone

The most you can lose on any stock (assuming you don't use leverage) is 100% of your money. But on the bright side, you can make far more than 100% on a really good stock. One great example is Al-Omran Industrial Trading Company (TADAWUL:4141) which saw its share price drive 136% higher over five years. Better yet, the share price has risen 10% in the last week.
After a strong gain in the past week, it's worth seeing if longer term returns have been driven by improving fundamentals.
View our latest analysis for Al-Omran Industrial Trading
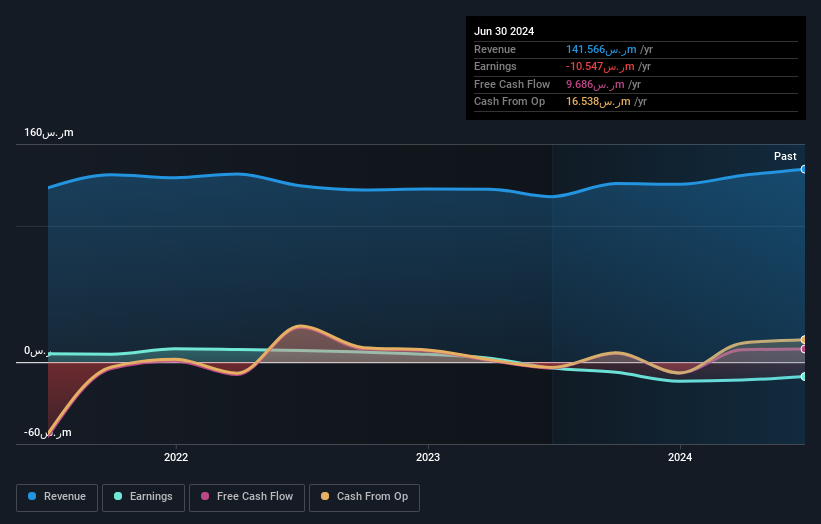
Al-Omran Industrial Trading isn't currently profitable, so most analysts would look to revenue growth to get an idea of how fast the underlying business is growing. When a company doesn't make profits, we'd generally hope to see good revenue growth. That's because it's hard to be confident a company will be sustainable if revenue growth is negligible, and it never makes a profit.
For the last half decade, Al-Omran Industrial Trading can boast revenue growth at a rate of 1.2% per year. Put simply, that growth rate fails to impress. So we wouldn't have expected to see the share price to have lifted 19% for each year during that time, but that's what happened. Shareholders should be pretty happy with that, although interested investors might want to examine the financial data more closely to see if the gains are really justified. It may be that the market is pretty optimistic about Al-Omran Industrial Trading.
The graphic below depicts how earnings and revenue have changed over time (unveil the exact values by clicking on the image).

You can see how its balance sheet has strengthened (or weakened) over time in this free interactive graphic.
What About The Total Shareholder Return (TSR)?
Investors should note that there's a difference between Al-Omran Industrial Trading's total shareholder return (TSR) and its share price change, which we've covered above. The TSR is a return calculation that accounts for the value of cash dividends (assuming that any dividend received was reinvested) and the calculated value of any discounted capital raisings and spin-offs. We note that Al-Omran Industrial Trading's TSR, at 306% is higher than its share price return of 136%. When you consider it hasn't been paying a dividend, this data suggests shareholders have benefitted from a spin-off, or had the opportunity to acquire attractively priced shares in a discounted capital raising.
A Different Perspective
We're pleased to report that Al-Omran Industrial Trading shareholders have received a total shareholder return of 6.7% over one year. However, that falls short of the 32% TSR per annum it has made for shareholders, each year, over five years. Potential buyers might understandably feel they've missed the opportunity, but it's always possible business is still firing on all cylinders. While it is well worth considering the different impacts that market conditions can have on the share price, there are other factors that are even more important. Consider risks, for instance. Every company has them, and we've spotted 2 warning signs for Al-Omran Industrial Trading you should know about.
Of course, you might find a fantastic investment by looking elsewhere. So take a peek at this free list of companies we expect will grow earnings.
Please note, the market returns quoted in this article reflect the market weighted average returns of stocks that currently trade on Saudi exchanges.
New: Manage All Your Stock Portfolios in One Place
We've created the ultimate portfolio companion for stock investors, and it's free.
• Connect an unlimited number of Portfolios and see your total in one currency
• Be alerted to new Warning Signs or Risks via email or mobile
• Track the Fair Value of your stocks
Have feedback on this article? Concerned about the content? Get in touch with us directly. Alternatively, email editorial-team (at) simplywallst.com.
This article by Simply Wall St is general in nature. We provide commentary based on historical data and analyst forecasts only using an unbiased methodology and our articles are not intended to be financial advice. It does not constitute a recommendation to buy or sell any stock, and does not take account of your objectives, or your financial situation. We aim to bring you long-term focused analysis driven by fundamental data. Note that our analysis may not factor in the latest price-sensitive company announcements or qualitative material. Simply Wall St has no position in any stocks mentioned.
About SASE:4141
Al-Omran Industrial Trading
Manufactures, imports, sells, wholesales, retails, and exports household and electronic devices and products.
Excellent balance sheet very low.


