- Russia
- /
- Construction
- /
- MISX:EELT
European Eltech Public Joint Stock Company's (MCX:EELT) Fundamentals Look Pretty Strong: Could The Market Be Wrong About The Stock?


It is hard to get excited after looking at European Eltech's (MCX:EELT) recent performance, when its stock has declined 8.3% over the past three months. However, a closer look at its sound financials might cause you to think again. Given that fundamentals usually drive long-term market outcomes, the company is worth looking at. In this article, we decided to focus on European Eltech's ROE.
Return on Equity or ROE is a test of how effectively a company is growing its value and managing investors’ money. Simply put, it is used to assess the profitability of a company in relation to its equity capital.
Check out our latest analysis for European Eltech
How Do You Calculate Return On Equity?
ROE can be calculated by using the formula:
Return on Equity = Net Profit (from continuing operations) ÷ Shareholders' Equity
So, based on the above formula, the ROE for European Eltech is:
27% = ₽286m ÷ ₽1.0b (Based on the trailing twelve months to September 2020).
The 'return' is the income the business earned over the last year. So, this means that for every RUB1 of its shareholder's investments, the company generates a profit of RUB0.27.
What Is The Relationship Between ROE And Earnings Growth?
We have already established that ROE serves as an efficient profit-generating gauge for a company's future earnings. We now need to evaluate how much profit the company reinvests or "retains" for future growth which then gives us an idea about the growth potential of the company. Assuming everything else remains unchanged, the higher the ROE and profit retention, the higher the growth rate of a company compared to companies that don't necessarily bear these characteristics.
European Eltech's Earnings Growth And 27% ROE
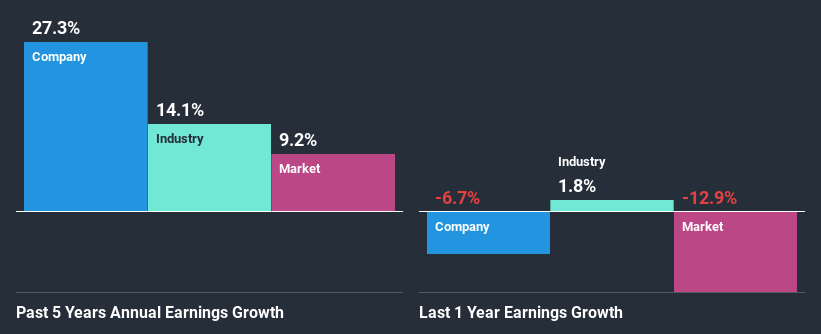
At first glance, European Eltech seems to have a decent ROE. On comparing with the average industry ROE of 11% the company's ROE looks pretty remarkable. This probably laid the ground for European Eltech's significant 27% net income growth seen over the past five years. We reckon that there could also be other factors at play here. For instance, the company has a low payout ratio or is being managed efficiently.
Next, on comparing with the industry net income growth, we found that European Eltech's growth is quite high when compared to the industry average growth of 7.2% in the same period, which is great to see.
Earnings growth is an important metric to consider when valuing a stock. The investor should try to establish if the expected growth or decline in earnings, whichever the case may be, is priced in. By doing so, they will have an idea if the stock is headed into clear blue waters or if swampy waters await. One good indicator of expected earnings growth is the P/E ratio which determines the price the market is willing to pay for a stock based on its earnings prospects. So, you may want to check if European Eltech is trading on a high P/E or a low P/E, relative to its industry.
Is European Eltech Making Efficient Use Of Its Profits?
Conclusion
In total, we are pretty happy with European Eltech's performance. Particularly, we like that the company is reinvesting heavily into its business, and at a high rate of return. Unsurprisingly, this has led to an impressive earnings growth. If the company continues to grow its earnings the way it has, that could have a positive impact on its share price given how earnings per share influence long-term share prices. Not to forget, share price outcomes are also dependent on the potential risks a company may face. So it is important for investors to be aware of the risks involved in the business. Our risks dashboard will have the 1 risk we have identified for European Eltech.
If you decide to trade European Eltech, use the lowest-cost* platform that is rated #1 Overall by Barron’s, Interactive Brokers. Trade stocks, options, futures, forex, bonds and funds on 135 markets, all from a single integrated account. Promoted
Valuation is complex, but we're here to simplify it.
Discover if European Eltech might be undervalued or overvalued with our detailed analysis, featuring fair value estimates, potential risks, dividends, insider trades, and its financial condition.
Access Free AnalysisThis article by Simply Wall St is general in nature. It does not constitute a recommendation to buy or sell any stock, and does not take account of your objectives, or your financial situation. We aim to bring you long-term focused analysis driven by fundamental data. Note that our analysis may not factor in the latest price-sensitive company announcements or qualitative material. Simply Wall St has no position in any stocks mentioned.
*Interactive Brokers Rated Lowest Cost Broker by StockBrokers.com Annual Online Review 2020
Have feedback on this article? Concerned about the content? Get in touch with us directly. Alternatively, email editorial-team (at) simplywallst.com.
About MISX:EELT
European Eltech
European Eltech Public Joint Stock Company operates in the electrical engineering market.
Adequate balance sheet with acceptable track record.
Market Insights

Community Narratives
