Should You Be Impressed By Gosa Fom a.d's (BELEX:GFOM) Returns on Capital?


If we want to find a stock that could multiply over the long term, what are the underlying trends we should look for? One common approach is to try and find a company with returns on capital employed (ROCE) that are increasing, in conjunction with a growing amount of capital employed. This shows us that it's a compounding machine, able to continually reinvest its earnings back into the business and generate higher returns. Having said that, from a first glance at Gosa Fom a.d (BELEX:GFOM) we aren't jumping out of our chairs at how returns are trending, but let's have a deeper look.
What is Return On Capital Employed (ROCE)?
For those who don't know, ROCE is a measure of a company's yearly pre-tax profit (its return), relative to the capital employed in the business. Analysts use this formula to calculate it for Gosa Fom a.d:
Return on Capital Employed = Earnings Before Interest and Tax (EBIT) ÷ (Total Assets - Current Liabilities)
0.05 = дин80m ÷ (дин4.8b - дин3.2b) (Based on the trailing twelve months to December 2019).
Therefore, Gosa Fom a.d has an ROCE of 5.0%. In absolute terms, that's a low return and it also under-performs the Machinery industry average of 8.5%.
See our latest analysis for Gosa Fom a.d
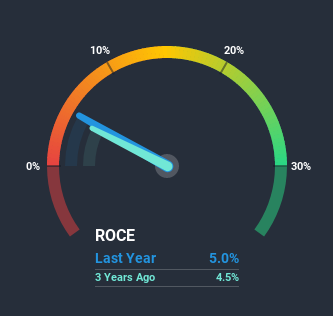
While the past is not representative of the future, it can be helpful to know how a company has performed historically, which is why we have this chart above. If you want to delve into the historical earnings, revenue and cash flow of Gosa Fom a.d, check out these free graphs here.
What Can We Tell From Gosa Fom a.d's ROCE Trend?
Over the past five years, Gosa Fom a.d's ROCE and capital employed have both remained mostly flat. It's not uncommon to see this when looking at a mature and stable business that isn't re-investing its earnings because it has likely passed that phase of the business cycle. With that in mind, unless investment picks up again in the future, we wouldn't expect Gosa Fom a.d to be a multi-bagger going forward.
Another point to note, we noticed the company has increased current liabilities over the last five years. This is intriguing because if current liabilities hadn't increased to 66% of total assets, this reported ROCE would probably be less than5.0% because total capital employed would be higher.The 5.0% ROCE could be even lower if current liabilities weren't 66% of total assets, because the the formula would show a larger base of total capital employed. So with current liabilities at such high levels, this effectively means the likes of suppliers or short-term creditors are funding a meaningful part of the business, which in some instances can bring some risks.The Bottom Line On Gosa Fom a.d's ROCE
In summary, Gosa Fom a.d isn't compounding its earnings but is generating stable returns on the same amount of capital employed. Since the stock has gained an impressive 95% over the last five years, investors must think there's better things to come. But if the trajectory of these underlying trends continue, we think the likelihood of it being a multi-bagger from here isn't high.
If you'd like to know more about Gosa Fom a.d, we've spotted 3 warning signs, and 2 of them are significant.
While Gosa Fom a.d isn't earning the highest return, check out this free list of companies that are earning high returns on equity with solid balance sheets.
When trading Gosa Fom a.d or any other investment, use the platform considered by many to be the Professional's Gateway to the Worlds Market, Interactive Brokers. You get the lowest-cost* trading on stocks, options, futures, forex, bonds and funds worldwide from a single integrated account. Promoted
New: Manage All Your Stock Portfolios in One Place
We've created the ultimate portfolio companion for stock investors, and it's free.
• Connect an unlimited number of Portfolios and see your total in one currency
• Be alerted to new Warning Signs or Risks via email or mobile
• Track the Fair Value of your stocks
This article by Simply Wall St is general in nature. It does not constitute a recommendation to buy or sell any stock, and does not take account of your objectives, or your financial situation. We aim to bring you long-term focused analysis driven by fundamental data. Note that our analysis may not factor in the latest price-sensitive company announcements or qualitative material. Simply Wall St has no position in any stocks mentioned.
*Interactive Brokers Rated Lowest Cost Broker by StockBrokers.com Annual Online Review 2020
Have feedback on this article? Concerned about the content? Get in touch with us directly. Alternatively, email editorial-team (at) simplywallst.com.
About BELEX:GFOM
Gosa Fom a.d
Engages in the production and sale of equipment for lifting and transferring in Serbia and internationally.
Flawless balance sheet and good value.
Market Insights

Community Narratives

