
Advertisement
Is Gosa Fom a.d.'s (BELEX:GFOM) Latest Stock Performance A Reflection Of Its Financial Health?

Gosa Fom a.d (BELEX:GFOM) has had a great run on the share market with its stock up by a significant 115% over the last three months. Given the company's impressive performance, we decided to study its financial indicators more closely as a company's financial health over the long-term usually dictates market outcomes. Particularly, we will be paying attention to Gosa Fom a.d's ROE today.
Return on equity or ROE is a key measure used to assess how efficiently a company's management is utilizing the company's capital. In simpler terms, it measures the profitability of a company in relation to shareholder's equity.
Check out our latest analysis for Gosa Fom a.d
How Do You Calculate Return On Equity?
The formula for return on equity is:
Return on Equity = Net Profit (from continuing operations) ÷ Shareholders' Equity
So, based on the above formula, the ROE for Gosa Fom a.d is:
12% = дин207m ÷ дин1.7b (Based on the trailing twelve months to December 2023).
The 'return' is the profit over the last twelve months. So, this means that for every RSD1 of its shareholder's investments, the company generates a profit of RSD0.12.
What Is The Relationship Between ROE And Earnings Growth?
Thus far, we have learned that ROE measures how efficiently a company is generating its profits. Based on how much of its profits the company chooses to reinvest or "retain", we are then able to evaluate a company's future ability to generate profits. Assuming all else is equal, companies that have both a higher return on equity and higher profit retention are usually the ones that have a higher growth rate when compared to companies that don't have the same features.
A Side By Side comparison of Gosa Fom a.d's Earnings Growth And 12% ROE
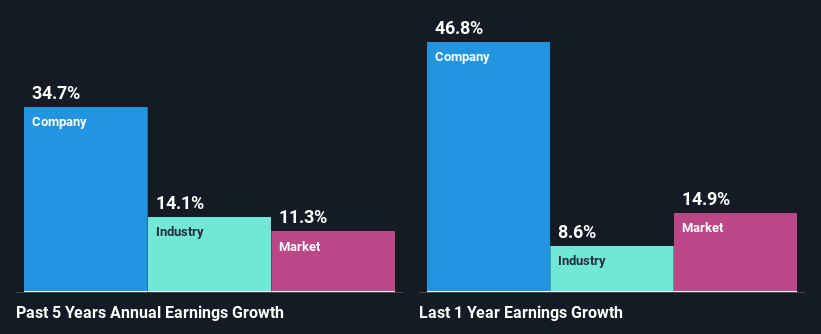
To start with, Gosa Fom a.d's ROE looks acceptable. Further, the company's ROE is similar to the industry average of 11%. This certainly adds some context to Gosa Fom a.d's exceptional 35% net income growth seen over the past five years. We reckon that there could also be other factors at play here. For instance, the company has a low payout ratio or is being managed efficiently.
As a next step, we compared Gosa Fom a.d's net income growth with the industry, and pleasingly, we found that the growth seen by the company is higher than the average industry growth of 14%.
The basis for attaching value to a company is, to a great extent, tied to its earnings growth. The investor should try to establish if the expected growth or decline in earnings, whichever the case may be, is priced in. By doing so, they will have an idea if the stock is headed into clear blue waters or if swampy waters await. Is GFOM fairly valued? This infographic on the company's intrinsic value has everything you need to know.
Is Gosa Fom a.d Using Its Retained Earnings Effectively?
Gosa Fom a.d has a significant three-year median payout ratio of 64%, meaning the company only retains 36% of its income. This implies that the company has been able to achieve high earnings growth despite returning most of its profits to shareholders.
Summary
Overall, we are quite pleased with Gosa Fom a.d's performance. We are particularly impressed by the considerable earnings growth posted by the company, which was likely backed by its high ROE. While the company is paying out most of its earnings as dividends, it has been able to grow its earnings in spite of it, so that's probably a good sign. So far, we've only made a quick discussion around the company's earnings growth. So it may be worth checking this free detailed graph of Gosa Fom a.d's past earnings, as well as revenue and cash flows to get a deeper insight into the company's performance.
New: Manage All Your Stock Portfolios in One Place
We've created the ultimate portfolio companion for stock investors, and it's free.
• Connect an unlimited number of Portfolios and see your total in one currency
• Be alerted to new Warning Signs or Risks via email or mobile
• Track the Fair Value of your stocks
Have feedback on this article? Concerned about the content? Get in touch with us directly. Alternatively, email editorial-team (at) simplywallst.com.
This article by Simply Wall St is general in nature. We provide commentary based on historical data and analyst forecasts only using an unbiased methodology and our articles are not intended to be financial advice. It does not constitute a recommendation to buy or sell any stock, and does not take account of your objectives, or your financial situation. We aim to bring you long-term focused analysis driven by fundamental data. Note that our analysis may not factor in the latest price-sensitive company announcements or qualitative material. Simply Wall St has no position in any stocks mentioned.
Have feedback on this article? Concerned about the content? Get in touch with us directly. Alternatively, email editorial-team@simplywallst.com
About BELEX:GFOM
Gosa Fom a.d
Engages in the production and sale of equipment for lifting and transferring in Serbia and internationally.
Flawless balance sheet with solid track record.
Market Insights


Advertisement
Community Narratives
Suncorp’s Next Chapter: Insurance-Only and Ready to Grow
Fair Value AU$22.83|5.7% undervalued
RO
Community Contributor
Thyssenkrupp Nucera Will Achieve Double-Digit Profits by 2030 Boosted by Hydrogen Growth
Fair Value €14.40|32.5% undervalued
CH
Community Contributor
Tesla’s Nvidia Moment – The AI & Robotics Inflection Point
Fair Value US$384.84|21.9% undervalued
BL
Community Contributor