
Advertisement
- Romania
- /
- Marine and Shipping
- /
- BVB:BRNA
Will Weakness in S.C. Romnav S.A.'s (BVB:BRNA) Stock Prove Temporary Given Strong Fundamentals?

S.C. Romnav (BVB:BRNA) has had a rough three months with its share price down 28%. But if you pay close attention, you might gather that its strong financials could mean that the stock could potentially see an increase in value in the long-term, given how markets usually reward companies with good financial health. In this article, we decided to focus on S.C. Romnav's ROE.
Return on Equity or ROE is a test of how effectively a company is growing its value and managing investors’ money. Simply put, it is used to assess the profitability of a company in relation to its equity capital.
View our latest analysis for S.C. Romnav
How Do You Calculate Return On Equity?
ROE can be calculated by using the formula:
Return on Equity = Net Profit (from continuing operations) ÷ Shareholders' Equity
So, based on the above formula, the ROE for S.C. Romnav is:
29% = RON29m ÷ RON100m (Based on the trailing twelve months to December 2023).
The 'return' is the profit over the last twelve months. That means that for every RON1 worth of shareholders' equity, the company generated RON0.29 in profit.
Why Is ROE Important For Earnings Growth?
Thus far, we have learned that ROE measures how efficiently a company is generating its profits. Based on how much of its profits the company chooses to reinvest or "retain", we are then able to evaluate a company's future ability to generate profits. Assuming all else is equal, companies that have both a higher return on equity and higher profit retention are usually the ones that have a higher growth rate when compared to companies that don't have the same features.
A Side By Side comparison of S.C. Romnav's Earnings Growth And 29% ROE
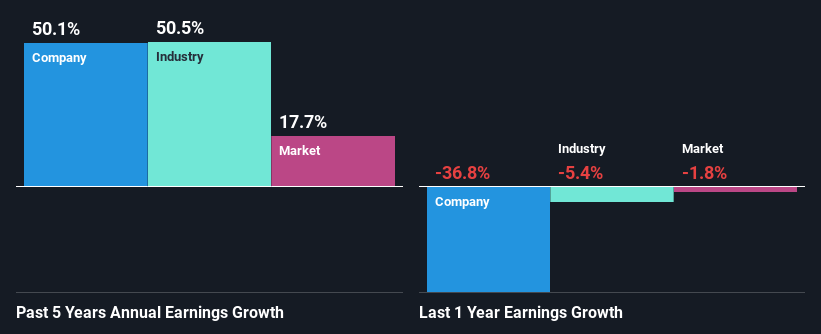
To begin with, S.C. Romnav has a pretty high ROE which is interesting. Additionally, the company's ROE is higher compared to the industry average of 22% which is quite remarkable. As a result, S.C. Romnav's exceptional 50% net income growth seen over the past five years, doesn't come as a surprise.
As a next step, we compared S.C. Romnav's net income growth with the industry and found that the company has a similar growth figure when compared with the industry average growth rate of 51% in the same period.
The basis for attaching value to a company is, to a great extent, tied to its earnings growth. It’s important for an investor to know whether the market has priced in the company's expected earnings growth (or decline). Doing so will help them establish if the stock's future looks promising or ominous. If you're wondering about S.C. Romnav's's valuation, check out this gauge of its price-to-earnings ratio, as compared to its industry.
Is S.C. Romnav Making Efficient Use Of Its Profits?
The three-year median payout ratio for S.C. Romnav is 25%, which is moderately low. The company is retaining the remaining 75%. This suggests that its dividend is well covered, and given the high growth we discussed above, it looks like S.C. Romnav is reinvesting its earnings efficiently.
While S.C. Romnav has been growing its earnings, it only recently started to pay dividends which likely means that the company decided to impress new and existing shareholders with a dividend.
Conclusion
On the whole, we feel that S.C. Romnav's performance has been quite good. In particular, it's great to see that the company is investing heavily into its business and along with a high rate of return, that has resulted in a sizeable growth in its earnings. If the company continues to grow its earnings the way it has, that could have a positive impact on its share price given how earnings per share influence long-term share prices. Not to forget, share price outcomes are also dependent on the potential risks a company may face. So it is important for investors to be aware of the risks involved in the business. You can see the 3 risks we have identified for S.C. Romnav by visiting our risks dashboard for free on our platform here.
New: Manage All Your Stock Portfolios in One Place
We've created the ultimate portfolio companion for stock investors, and it's free.
• Connect an unlimited number of Portfolios and see your total in one currency
• Be alerted to new Warning Signs or Risks via email or mobile
• Track the Fair Value of your stocks
Have feedback on this article? Concerned about the content? Get in touch with us directly. Alternatively, email editorial-team (at) simplywallst.com.
This article by Simply Wall St is general in nature. We provide commentary based on historical data and analyst forecasts only using an unbiased methodology and our articles are not intended to be financial advice. It does not constitute a recommendation to buy or sell any stock, and does not take account of your objectives, or your financial situation. We aim to bring you long-term focused analysis driven by fundamental data. Note that our analysis may not factor in the latest price-sensitive company announcements or qualitative material. Simply Wall St has no position in any stocks mentioned.
Have feedback on this article? Concerned about the content? Get in touch with us directly. Alternatively, email editorial-team@simplywallst.com
About BVB:BRNA
Slight and fair value.
Market Insights


Advertisement
Community Narratives
For the Emperor: Why Games Workshop Could Be a Star Investment
Fair Value UK£160.00|0.4% overvalued
RO
Community Contributor
Securitas will boost margins with AI and tech-driven services
Fair Value SEK 260.91|44.5% undervalued
UN
Community Contributor
A Leader in EV Charging with Growth Potential
Fair Value €27.00|17.8% undervalued
TI
Community Contributor