
Advertisement
- Romania
- /
- Metals and Mining
- /
- BVB:SATU
Market Cool On S.C. Saturn S.A. Alba Iulia's (BVB:SATU) Earnings Pushing Shares 34% Lower
S.C. Saturn S.A. Alba Iulia (BVB:SATU) shareholders that were waiting for something to happen have been dealt a blow with a 34% share price drop in the last month. Longer-term shareholders will rue the drop in the share price, since it's now virtually flat for the year after a promising few quarters.
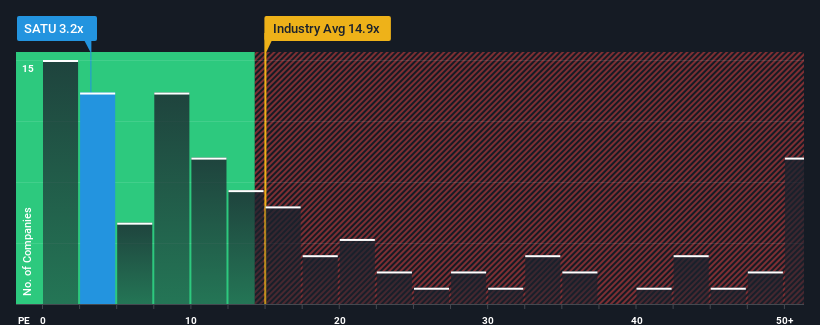
Following the heavy fall in price, S.C. Saturn Alba Iulia's price-to-earnings (or "P/E") ratio of 3.2x might make it look like a strong buy right now compared to the market in Romania, where around half of the companies have P/E ratios above 13x and even P/E's above 36x are quite common. However, the P/E might be quite low for a reason and it requires further investigation to determine if it's justified.
For example, consider that S.C. Saturn Alba Iulia's financial performance has been poor lately as its earnings have been in decline. One possibility is that the P/E is low because investors think the company won't do enough to avoid underperforming the broader market in the near future. However, if this doesn't eventuate then existing shareholders may be feeling optimistic about the future direction of the share price.
View our latest analysis for S.C. Saturn Alba Iulia
How Is S.C. Saturn Alba Iulia's Growth Trending?
S.C. Saturn Alba Iulia's P/E ratio would be typical for a company that's expected to deliver very poor growth or even falling earnings, and importantly, perform much worse than the market.
If we review the last year of earnings, dishearteningly the company's profits fell to the tune of 23%. Unfortunately, that's brought it right back to where it started three years ago with EPS growth being virtually non-existent overall during that time. Accordingly, shareholders probably wouldn't have been overly satisfied with the unstable medium-term growth rates.
In contrast to the company, the rest of the market is expected to decline by 5.1% over the next year, which puts the company's recent medium-term positive growth rates in a good light for now.
With this information, we find it very odd that S.C. Saturn Alba Iulia is trading at a P/E lower than the market. It looks like most investors are not convinced at all that the company can maintain its recent positive growth rate in the face of a shrinking broader market.
What We Can Learn From S.C. Saturn Alba Iulia's P/E?
Shares in S.C. Saturn Alba Iulia have plummeted and its P/E is now low enough to touch the ground. Typically, we'd caution against reading too much into price-to-earnings ratios when settling on investment decisions, though it can reveal plenty about what other market participants think about the company.
We've established that S.C. Saturn Alba Iulia currently trades on a much lower than expected P/E since its recent three-year earnings growth is beating forecasts for a struggling market. We think potential risks might be placing significant pressure on the P/E ratio and share price. Perhaps there is some hesitation about the company's ability to stay its recent course and swim against the current of the broader market turmoil. At least the risk of a price drop looks to be subdued, but investors think future earnings could see a lot of volatility.
Before you take the next step, you should know about the 2 warning signs for S.C. Saturn Alba Iulia that we have uncovered.
It's important to make sure you look for a great company, not just the first idea you come across. So take a peek at this free list of interesting companies with strong recent earnings growth (and a low P/E).
New: Manage All Your Stock Portfolios in One Place
We've created the ultimate portfolio companion for stock investors, and it's free.
• Connect an unlimited number of Portfolios and see your total in one currency
• Be alerted to new Warning Signs or Risks via email or mobile
• Track the Fair Value of your stocks
Have feedback on this article? Concerned about the content? Get in touch with us directly. Alternatively, email editorial-team (at) simplywallst.com.
This article by Simply Wall St is general in nature. We provide commentary based on historical data and analyst forecasts only using an unbiased methodology and our articles are not intended to be financial advice. It does not constitute a recommendation to buy or sell any stock, and does not take account of your objectives, or your financial situation. We aim to bring you long-term focused analysis driven by fundamental data. Note that our analysis may not factor in the latest price-sensitive company announcements or qualitative material. Simply Wall St has no position in any stocks mentioned.
About BVB:SATU
Flawless balance sheet and good value.
Market Insights

Advertisement
Community Narratives
Finding The True Value Of A Logistics Powerhouse
Fair Value US$95.21|8.7% undervalued
NV
Community Contributor
Paradigm Biopharmaceuticals Will Lead Osteoarthritis Treatment with Zilosul's FDA Success
Fair Value AU$5.50|93.3% undervalued
AM
Community Contributor
Barrick Mining (ABX:CA): A Gold Hedge against a U.S. Shutdown
Fair Value CA$60.00|18.7% undervalued
GM
Community Contributor