
Advertisement
- Qatar
- /
- Wireless Telecom
- /
- DSM:VFQS
Did Vodafone Qatar P.Q.S.C's (DSM:VFQS) Share Price Deserve to Gain 76%?
Passive investing in index funds can generate returns that roughly match the overall market. But one can do better than that by picking better than average stocks (as part of a diversified portfolio). To wit, the Vodafone Qatar P.Q.S.C. (DSM:VFQS) share price is 76% higher than it was a year ago, much better than the market return of around 24% (not including dividends) in the same period. If it can keep that out-performance up over the long term, investors will do very well! Zooming out, the stock is actually down 3.9% in the last three years.
View our latest analysis for Vodafone Qatar P.Q.S.C
To paraphrase Benjamin Graham: Over the short term the market is a voting machine, but over the long term it's a weighing machine. One imperfect but simple way to consider how the market perception of a company has shifted is to compare the change in the earnings per share (EPS) with the share price movement.
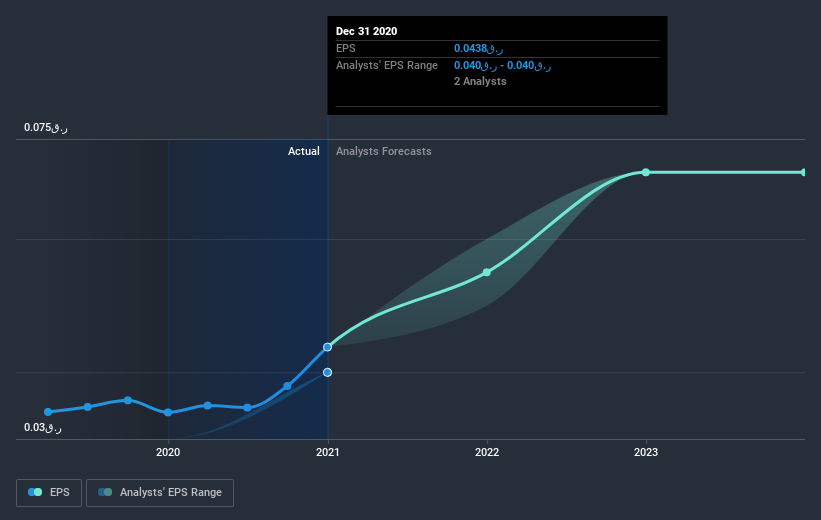
During the last year Vodafone Qatar P.Q.S.C grew its earnings per share (EPS) by 29%. The share price gain of 76% certainly outpaced the EPS growth. This indicates that the market is now more optimistic about the stock.
The company's earnings per share (over time) is depicted in the image below (click to see the exact numbers).
It is of course excellent to see how Vodafone Qatar P.Q.S.C has grown profits over the years, but the future is more important for shareholders. Take a more thorough look at Vodafone Qatar P.Q.S.C's financial health with this free report on its balance sheet.
What About Dividends?
As well as measuring the share price return, investors should also consider the total shareholder return (TSR). The TSR incorporates the value of any spin-offs or discounted capital raisings, along with any dividends, based on the assumption that the dividends are reinvested. It's fair to say that the TSR gives a more complete picture for stocks that pay a dividend. As it happens, Vodafone Qatar P.Q.S.C's TSR for the last year was 83%, which exceeds the share price return mentioned earlier. This is largely a result of its dividend payments!
A Different Perspective
It's nice to see that Vodafone Qatar P.Q.S.C shareholders have received a total shareholder return of 83% over the last year. Of course, that includes the dividend. That certainly beats the loss of about 6% per year over the last half decade. This makes us a little wary, but the business might have turned around its fortunes. I find it very interesting to look at share price over the long term as a proxy for business performance. But to truly gain insight, we need to consider other information, too. For example, we've discovered 1 warning sign for Vodafone Qatar P.Q.S.C that you should be aware of before investing here.
If you would prefer to check out another company -- one with potentially superior financials -- then do not miss this free list of companies that have proven they can grow earnings.
Please note, the market returns quoted in this article reflect the market weighted average returns of stocks that currently trade on QA exchanges.
If you decide to trade Vodafone Qatar P.Q.S.C, use the lowest-cost* platform that is rated #1 Overall by Barron’s, Interactive Brokers. Trade stocks, options, futures, forex, bonds and funds on 135 markets, all from a single integrated account. Promoted
New: Manage All Your Stock Portfolios in One Place
We've created the ultimate portfolio companion for stock investors, and it's free.
• Connect an unlimited number of Portfolios and see your total in one currency
• Be alerted to new Warning Signs or Risks via email or mobile
• Track the Fair Value of your stocks
This article by Simply Wall St is general in nature. It does not constitute a recommendation to buy or sell any stock, and does not take account of your objectives, or your financial situation. We aim to bring you long-term focused analysis driven by fundamental data. Note that our analysis may not factor in the latest price-sensitive company announcements or qualitative material. Simply Wall St has no position in any stocks mentioned.
*Interactive Brokers Rated Lowest Cost Broker by StockBrokers.com Annual Online Review 2020
Have feedback on this article? Concerned about the content? Get in touch with us directly. Alternatively, email editorial-team (at) simplywallst.com.
About DSM:VFQS
Vodafone Qatar P.Q.S.C
Provides cellular mobile telecommunication, and fixed-line and broadband services in Qatar.
Excellent balance sheet with proven track record and pays a dividend.
Market Insights

Advertisement
Community Narratives
MicroVision will explode future revenue by 380.37% with a vision towards success
Fair Value US$60|98.4% undervalued
TH
Community Contributor
The Indispensable Artery for a New North American Economy
Fair Value CA$132.87|0.7% overvalued
TI
Community Contributor
Recently Updated Narratives
CO

composite32 on Astor Enerji ·
Astor Enerji will surge with a fair value of $140.43 in the next 3 years
Fair Value:₺140.4335.5% undervalued
1 followerusers have followed this narrative
0 commentsusers have commented on this narrative
0 likesusers have liked this narrative
RE

RecMag on Proximus ·
Proximus: The State-Backed Backup Plan with 7% Gross Yield and 15% Currency Upside.
Fair Value:€17.1356.7% undervalued
30 followersusers have followed this narrative
0 commentsusers have commented on this narrative
0 likesusers have liked this narrative
AG


Agricola on IMPACT Silver ·
A case for for IMPACT Silver Corp (TSXV:IPT) to reach USD $4.52 (CAD $6.16) in 2026 (23 bagger in 1 year) and USD $5.76 (CAD $7.89) by 2030
Fair Value:CA$7.8996.2% undervalued
1 followerusers have followed this narrative
0 commentsusers have commented on this narrative
0 likesusers have liked this narrative
Popular Narratives
TH

TheWallstreetKing on MicroVision ·
MicroVision will explode future revenue by 380.37% with a vision towards success
Fair Value:US$6098.4% undervalued
101 followersusers have followed this narrative
10 commentsusers have commented on this narrative
20 likesusers have liked this narrative
OS


oscargarcia on Alphabet ·
The company that turned a verb into a global necessity and basically runs the modern internet, digital ads, smartphones, maps, and AI.
Fair Value:US$3405.8% undervalued
138 followersusers have followed this narrative
6 commentsusers have commented on this narrative
18 likesusers have liked this narrative
AN


AnalystConsensusTarget on NVIDIA ·
NVDA: Expanding AI Demand Will Drive Major Data Center Investments Through 2026
Fair Value:US$250.3929.3% undervalued
930 followersusers have followed this narrative
6 commentsusers have commented on this narrative
23 likesusers have liked this narrative