
Advertisement
- Qatar
- /
- Telecom Services and Carriers
- /
- DSM:ORDS
The total return for Ooredoo Q.P.S.C (DSM:ORDS) investors has risen faster than earnings growth over the last five years

Generally speaking the aim of active stock picking is to find companies that provide returns that are superior to the market average. And while active stock picking involves risks (and requires diversification) it can also provide excess returns. For example, long term Ooredoo Q.P.S.C. (DSM:ORDS) shareholders have enjoyed a 78% share price rise over the last half decade, well in excess of the market return of around 11% (not including dividends). However, more recent returns haven't been as impressive as that, with the stock returning just 29% in the last year, including dividends.
While this past week has detracted from the company's five-year return, let's look at the recent trends of the underlying business and see if the gains have been in alignment.
While the efficient markets hypothesis continues to be taught by some, it has been proven that markets are over-reactive dynamic systems, and investors are not always rational. One way to examine how market sentiment has changed over time is to look at the interaction between a company's share price and its earnings per share (EPS).
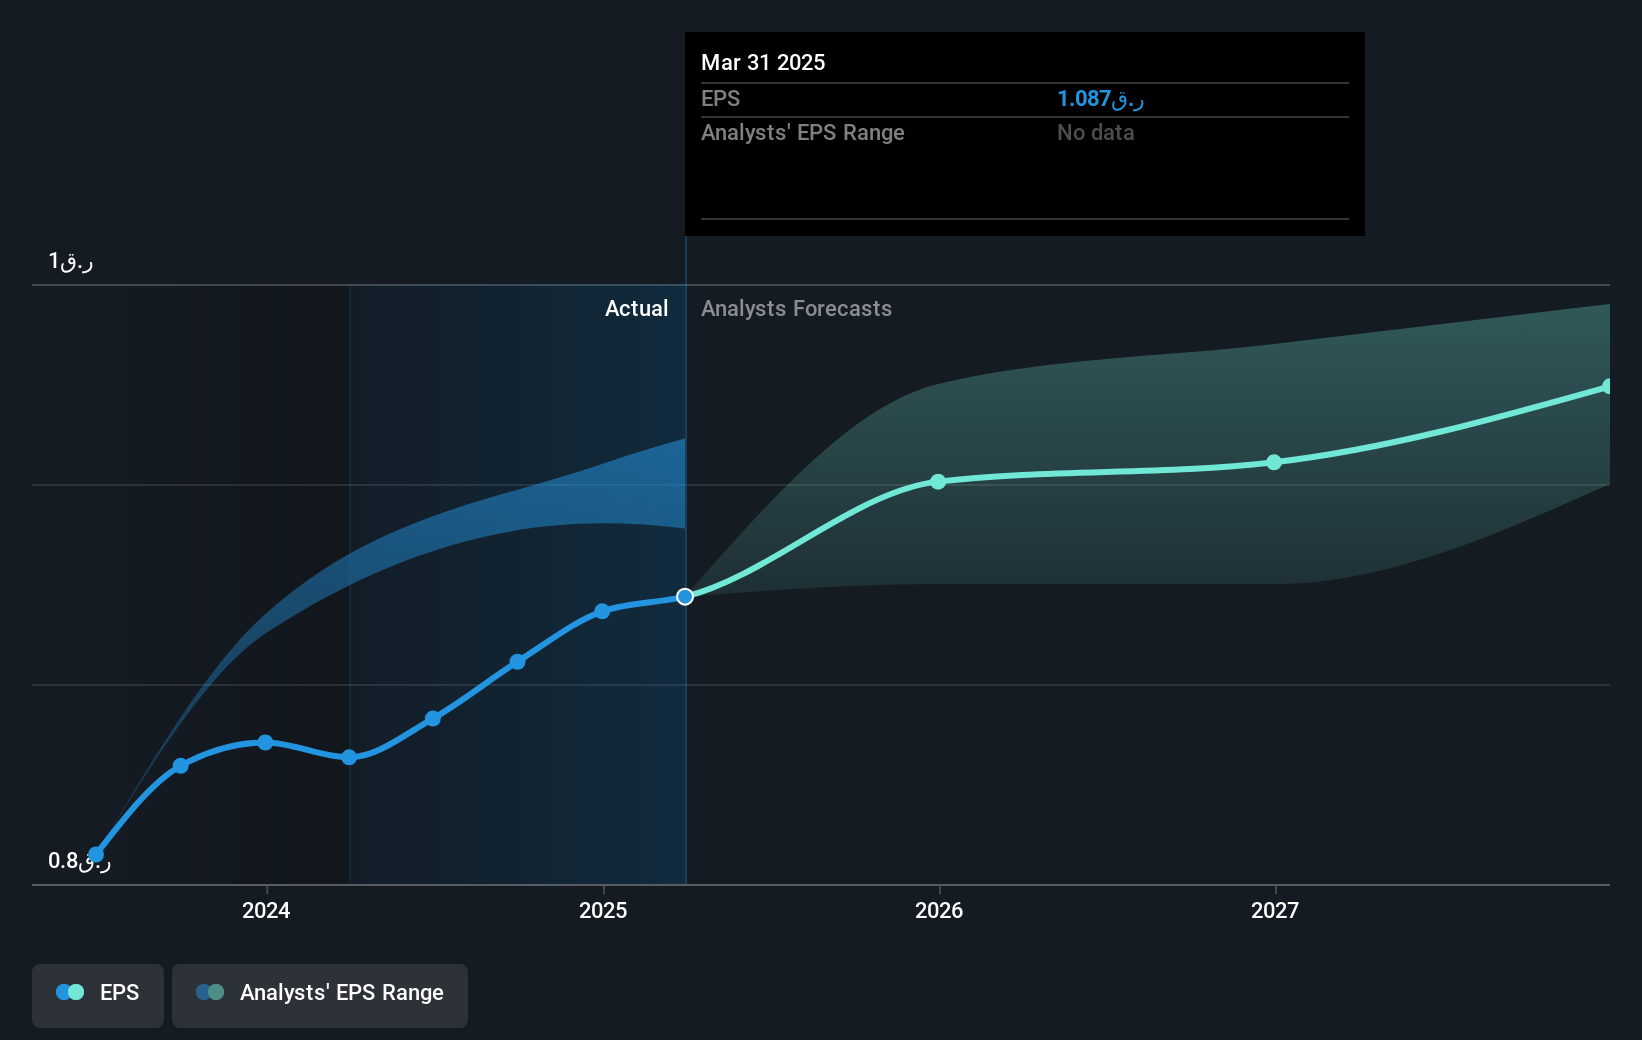
Over half a decade, Ooredoo Q.P.S.C managed to grow its earnings per share at 16% a year. This EPS growth is higher than the 12% average annual increase in the share price. Therefore, it seems the market has become relatively pessimistic about the company. This cautious sentiment is reflected in its (fairly low) P/E ratio of 10.98.
The image below shows how EPS has tracked over time (if you click on the image you can see greater detail).
It is of course excellent to see how Ooredoo Q.P.S.C has grown profits over the years, but the future is more important for shareholders. Take a more thorough look at Ooredoo Q.P.S.C's financial health with this free report on its balance sheet.
What About Dividends?
When looking at investment returns, it is important to consider the difference between total shareholder return (TSR) and share price return. The TSR is a return calculation that accounts for the value of cash dividends (assuming that any dividend received was reinvested) and the calculated value of any discounted capital raisings and spin-offs. It's fair to say that the TSR gives a more complete picture for stocks that pay a dividend. In the case of Ooredoo Q.P.S.C, it has a TSR of 123% for the last 5 years. That exceeds its share price return that we previously mentioned. And there's no prize for guessing that the dividend payments largely explain the divergence!
A Different Perspective
We're pleased to report that Ooredoo Q.P.S.C shareholders have received a total shareholder return of 29% over one year. And that does include the dividend. That gain is better than the annual TSR over five years, which is 17%. Therefore it seems like sentiment around the company has been positive lately. In the best case scenario, this may hint at some real business momentum, implying that now could be a great time to delve deeper. I find it very interesting to look at share price over the long term as a proxy for business performance. But to truly gain insight, we need to consider other information, too. Case in point: We've spotted 1 warning sign for Ooredoo Q.P.S.C you should be aware of.
If you are like me, then you will not want to miss this free list of undervalued small caps that insiders are buying.
Please note, the market returns quoted in this article reflect the market weighted average returns of stocks that currently trade on Qatari exchanges.
New: AI Stock Screener & Alerts
Our new AI Stock Screener scans the market every day to uncover opportunities.
• Dividend Powerhouses (3%+ Yield)
• Undervalued Small Caps with Insider Buying
• High growth Tech and AI Companies
Or build your own from over 50 metrics.
Have feedback on this article? Concerned about the content? Get in touch with us directly. Alternatively, email editorial-team (at) simplywallst.com.
This article by Simply Wall St is general in nature. We provide commentary based on historical data and analyst forecasts only using an unbiased methodology and our articles are not intended to be financial advice. It does not constitute a recommendation to buy or sell any stock, and does not take account of your objectives, or your financial situation. We aim to bring you long-term focused analysis driven by fundamental data. Note that our analysis may not factor in the latest price-sensitive company announcements or qualitative material. Simply Wall St has no position in any stocks mentioned.
About DSM:ORDS
Ooredoo Q.P.S.C
Provides telecommunications services in Qatar, rest of the Middle East, Asia, and North Africa region.
Flawless balance sheet, undervalued and pays a dividend.
Market Insights

Advertisement
Community Narratives
The Future of Drug Testing? Fingerprint Tech Shows Serious Promise
Fair Value US$2.98|35.9% undervalued
JO
Community Contributor
Occidental Petroleum is set to achieve a 16% profit margin improvement
Fair Value US$55.05|15.6% undervalued
DZ
Community Contributor
Argan's Revenue Set to Soar with a 13.31% Growth in the Coming Decade
Fair Value US$284.68|23.4% undervalued
KE
Community Contributor
EU#1 - From German Startup to EU’s Biggest Company
Fair Value €248.62|2.5% overvalued
TO
Community Contributor