Advertisement
Is Sonel (WSE:SON) Using Too Much Debt?
Legendary fund manager Li Lu (who Charlie Munger backed) once said, 'The biggest investment risk is not the volatility of prices, but whether you will suffer a permanent loss of capital.' It's only natural to consider a company's balance sheet when you examine how risky it is, since debt is often involved when a business collapses. We can see that Sonel S.A. (WSE:SON) does use debt in its business. But the more important question is: how much risk is that debt creating?
Why Does Debt Bring Risk?
Debt assists a business until the business has trouble paying it off, either with new capital or with free cash flow. In the worst case scenario, a company can go bankrupt if it cannot pay its creditors. However, a more frequent (but still costly) occurrence is where a company must issue shares at bargain-basement prices, permanently diluting shareholders, just to shore up its balance sheet. Of course, plenty of companies use debt to fund growth, without any negative consequences. The first thing to do when considering how much debt a business uses is to look at its cash and debt together.
See our latest analysis for Sonel
How Much Debt Does Sonel Carry?
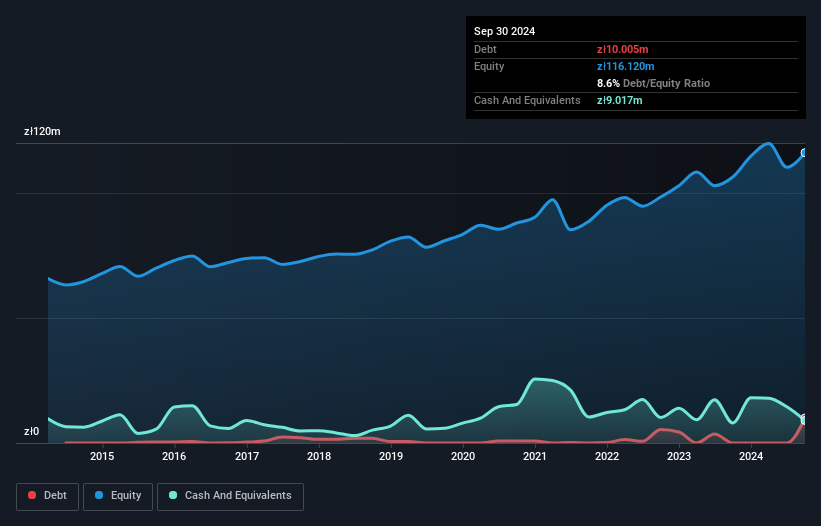
As you can see below, at the end of September 2024, Sonel had zł10.0m of debt, up from none a year ago. Click the image for more detail. However, it does have zł9.02m in cash offsetting this, leading to net debt of about zł988.0k.
A Look At Sonel's Liabilities
According to the last reported balance sheet, Sonel had liabilities of zł59.3m due within 12 months, and liabilities of zł6.34m due beyond 12 months. Offsetting these obligations, it had cash of zł9.02m as well as receivables valued at zł40.6m due within 12 months. So its liabilities outweigh the sum of its cash and (near-term) receivables by zł16.0m.
Since publicly traded Sonel shares are worth a total of zł249.2m, it seems unlikely that this level of liabilities would be a major threat. However, we do think it is worth keeping an eye on its balance sheet strength, as it may change over time. But either way, Sonel has virtually no net debt, so it's fair to say it does not have a heavy debt load!
In order to size up a company's debt relative to its earnings, we calculate its net debt divided by its earnings before interest, tax, depreciation, and amortization (EBITDA) and its earnings before interest and tax (EBIT) divided by its interest expense (its interest cover). Thus we consider debt relative to earnings both with and without depreciation and amortization expenses.
Sonel has very little debt (net of cash), and boasts a debt to EBITDA ratio of 0.038 and EBIT of 26.7 times the interest expense. Indeed relative to its earnings its debt load seems light as a feather. On top of that, Sonel grew its EBIT by 32% over the last twelve months, and that growth will make it easier to handle its debt. When analysing debt levels, the balance sheet is the obvious place to start. But it is Sonel's earnings that will influence how the balance sheet holds up in the future. So when considering debt, it's definitely worth looking at the earnings trend. Click here for an interactive snapshot.
Finally, a business needs free cash flow to pay off debt; accounting profits just don't cut it. So the logical step is to look at the proportion of that EBIT that is matched by actual free cash flow. In the last three years, Sonel's free cash flow amounted to 28% of its EBIT, less than we'd expect. That weak cash conversion makes it more difficult to handle indebtedness.
Our View
Sonel's interest cover suggests it can handle its debt as easily as Cristiano Ronaldo could score a goal against an under 14's goalkeeper. But truth be told we feel its conversion of EBIT to free cash flow does undermine this impression a bit. Zooming out, Sonel seems to use debt quite reasonably; and that gets the nod from us. While debt does bring risk, when used wisely it can also bring a higher return on equity. The balance sheet is clearly the area to focus on when you are analysing debt. However, not all investment risk resides within the balance sheet - far from it. We've identified 2 warning signs with Sonel , and understanding them should be part of your investment process.
Of course, if you're the type of investor who prefers buying stocks without the burden of debt, then don't hesitate to discover our exclusive list of net cash growth stocks, today.
New: Manage All Your Stock Portfolios in One Place
We've created the ultimate portfolio companion for stock investors, and it's free.
• Connect an unlimited number of Portfolios and see your total in one currency
• Be alerted to new Warning Signs or Risks via email or mobile
• Track the Fair Value of your stocks
Have feedback on this article? Concerned about the content? Get in touch with us directly. Alternatively, email editorial-team (at) simplywallst.com.
This article by Simply Wall St is general in nature. We provide commentary based on historical data and analyst forecasts only using an unbiased methodology and our articles are not intended to be financial advice. It does not constitute a recommendation to buy or sell any stock, and does not take account of your objectives, or your financial situation. We aim to bring you long-term focused analysis driven by fundamental data. Note that our analysis may not factor in the latest price-sensitive company announcements or qualitative material. Simply Wall St has no position in any stocks mentioned.
About WSE:SON
Sonel
Engages in the production and sale of electronic measuring instruments in Poland.
Flawless balance sheet second-rate dividend payer.
Similar Companies
Market Insights


Advertisement
Weekly Picks
LO


Lou_Basenese on Giftify ·
Giftify ($GIFT): A Small-Cap Incentives Platform with More ScaleThan Its Valuation Suggests
Fair Value:US$2.562.2% undervalued
37 followersusers have followed this narrative
1 commentusers have commented on this narrative
9 likesusers have liked this narrative
HA


HarishPK on lululemon athletica ·
Quantifying the Transition: Why Lululemon’s Moat Remains Intact
Fair Value:US$161.828.9% undervalued
11 followersusers have followed this narrative
0 commentsusers have commented on this narrative
8 likesusers have liked this narrative
TR


tripledub on Alphabet ·
Warren Buffett Just Bet $10 Billion on Google. The Catch? You May Already Be Too Late.
Fair Value:US$23059.6% overvalued
41 followersusers have followed this narrative
1 commentusers have commented on this narrative
10 likesusers have liked this narrative
JO


John_Eric on Veeva Systems ·
AI-Powered Veeva Systems Poised for Solid Growth Amid Regulatory Stability
Fair Value:US$32039.9% undervalued
15 followersusers have followed this narrative
0 commentsusers have commented on this narrative
0 likesusers have liked this narrative
Recently Updated Narratives
ST

StoxEurope on Sipef ·
Why I Invest in SIPEF?
Fair Value:€12125.5% undervalued
13 followersusers have followed this narrative
4 commentsusers have commented on this narrative
0 likesusers have liked this narrative
GE

Germaine on Kucingko Berhad ·
Kucingko Berhad: Fundamentals Show Early Recovery as Creative Content Expansion Gains Traction
Fair Value:RM 0.012733.3% overvalued
1 followerusers have followed this narrative
0 commentsusers have commented on this narrative
0 likesusers have liked this narrative
BL


Blagget on BP Silver ·
“valer un Potosí” GOOGLE IT. Now you’re should be kinda locked in. Educate yourself, Read the rest.
Fair Value:CA$685.7% undervalued
1 followerusers have followed this narrative
0 commentsusers have commented on this narrative
0 likesusers have liked this narrative
Popular Narratives
IN


Investingwilly on Mastercard ·
Mastercard: The Best Dividend Stock You're Ignoring
Fair Value:US$75029.1% undervalued
84 followersusers have followed this narrative
1 commentusers have commented on this narrative
9 likesusers have liked this narrative
HA

HarishPK on Adobe ·
Adobe: A Probabilistic Case for Undervaluation
Fair Value:US$319.9630.8% undervalued
64 followersusers have followed this narrative
9 commentsusers have commented on this narrative
19 likesusers have liked this narrative
BL


BlackGoat on Cerebras Systems ·
The Wafer Giant Threatening NVIDIA's GPU Hegemony
Fair Value:US$415.5457.5% undervalued
59 followersusers have followed this narrative
3 commentsusers have commented on this narrative
10 likesusers have liked this narrative
Trending Discussion


AN

andre_k1tsg on Companhia de Saneamento de Minas Gerais ·
Eu André José Julião digo o caminho da melhorar a toda população esta entrando no trilhos.
0
|0