- Poland
- /
- Oil and Gas
- /
- WSE:UNT
Unimot's (WSE:UNT) five-year total shareholder returns outpace the underlying earnings growth


The Unimot S.A. (WSE:UNT) share price has had a bad week, falling 13%. But that doesn't change the fact that the returns over the last half decade have been spectacular. To be precise, the stock price is 600% higher than it was five years ago, a wonderful performance by any measure. So we don't think the recent decline in the share price means its story is a sad one. Only time will tell if there is still too much optimism currently reflected in the share price. It really delights us to see such great share price performance for investors.
In light of the stock dropping 13% in the past week, we want to investigate the longer term story, and see if fundamentals have been the driver of the company's positive five-year return.
Check out our latest analysis for Unimot
To paraphrase Benjamin Graham: Over the short term the market is a voting machine, but over the long term it's a weighing machine. One flawed but reasonable way to assess how sentiment around a company has changed is to compare the earnings per share (EPS) with the share price.
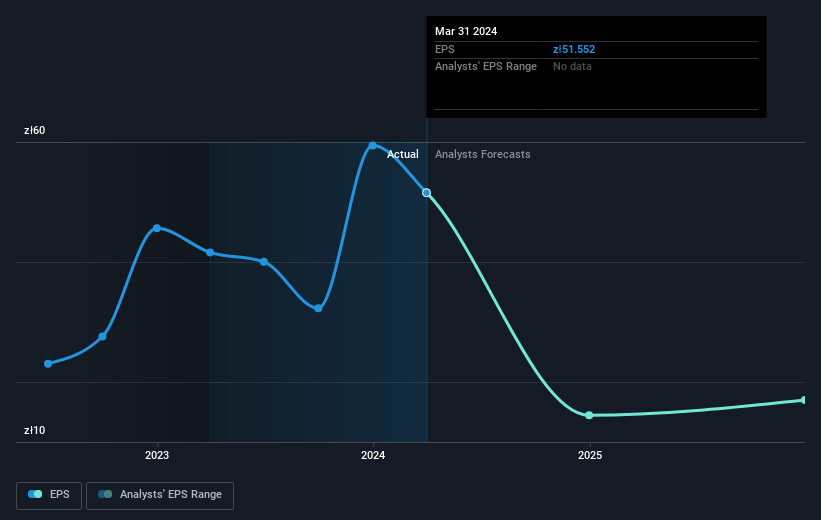
During five years of share price growth, Unimot achieved compound earnings per share (EPS) growth of 88% per year. The EPS growth is more impressive than the yearly share price gain of 48% over the same period. Therefore, it seems the market has become relatively pessimistic about the company. This cautious sentiment is reflected in its (fairly low) P/E ratio of 2.38.
You can see below how EPS has changed over time (discover the exact values by clicking on the image).
It is of course excellent to see how Unimot has grown profits over the years, but the future is more important for shareholders. This free interactive report on Unimot's balance sheet strength is a great place to start, if you want to investigate the stock further.
What About Dividends?
It is important to consider the total shareholder return, as well as the share price return, for any given stock. The TSR incorporates the value of any spin-offs or discounted capital raisings, along with any dividends, based on the assumption that the dividends are reinvested. So for companies that pay a generous dividend, the TSR is often a lot higher than the share price return. As it happens, Unimot's TSR for the last 5 years was 790%, which exceeds the share price return mentioned earlier. The dividends paid by the company have thusly boosted the total shareholder return.
A Different Perspective
It's nice to see that Unimot shareholders have received a total shareholder return of 27% over the last year. And that does include the dividend. However, the TSR over five years, coming in at 55% per year, is even more impressive. The pessimistic view would be that be that the stock has its best days behind it, but on the other hand the price might simply be moderating while the business itself continues to execute. It's always interesting to track share price performance over the longer term. But to understand Unimot better, we need to consider many other factors. Even so, be aware that Unimot is showing 3 warning signs in our investment analysis , and 2 of those don't sit too well with us...
We will like Unimot better if we see some big insider buys. While we wait, check out this free list of undervalued stocks (mostly small caps) with considerable, recent, insider buying.
Please note, the market returns quoted in this article reflect the market weighted average returns of stocks that currently trade on Polish exchanges.
New: AI Stock Screener & Alerts
Our new AI Stock Screener scans the market every day to uncover opportunities.
• Dividend Powerhouses (3%+ Yield)
• Undervalued Small Caps with Insider Buying
• High growth Tech and AI Companies
Or build your own from over 50 metrics.
Have feedback on this article? Concerned about the content? Get in touch with us directly. Alternatively, email editorial-team (at) simplywallst.com.
This article by Simply Wall St is general in nature. We provide commentary based on historical data and analyst forecasts only using an unbiased methodology and our articles are not intended to be financial advice. It does not constitute a recommendation to buy or sell any stock, and does not take account of your objectives, or your financial situation. We aim to bring you long-term focused analysis driven by fundamental data. Note that our analysis may not factor in the latest price-sensitive company announcements or qualitative material. Simply Wall St has no position in any stocks mentioned.
Have feedback on this article? Concerned about the content? Get in touch with us directly. Alternatively, email editorial-team@simplywallst.com
About WSE:UNT
Unimot
An independent fuel importer, engages in the wholesale and distribution of fuels in Poland.
Undervalued slight.

