
Advertisement
- Poland
- /
- Hospitality
- /
- WSE:SKN
Sakana S.A.'s (WSE:SKN) Stock Has Shown Weakness Lately But Financial Prospects Look Decent: Is The Market Wrong?

It is hard to get excited after looking at Sakana's (WSE:SKN) recent performance, when its stock has declined 15% over the past month. However, the company's fundamentals look pretty decent, and long-term financials are usually aligned with future market price movements. Particularly, we will be paying attention to Sakana's ROE today.
ROE or return on equity is a useful tool to assess how effectively a company can generate returns on the investment it received from its shareholders. In short, ROE shows the profit each dollar generates with respect to its shareholder investments.
See our latest analysis for Sakana
How Is ROE Calculated?
The formula for return on equity is:
Return on Equity = Net Profit (from continuing operations) ÷ Shareholders' Equity
So, based on the above formula, the ROE for Sakana is:
26% = zł495k ÷ zł1.9m (Based on the trailing twelve months to June 2023).
The 'return' is the profit over the last twelve months. Another way to think of that is that for every PLN1 worth of equity, the company was able to earn PLN0.26 in profit.
Why Is ROE Important For Earnings Growth?
Thus far, we have learned that ROE measures how efficiently a company is generating its profits. Depending on how much of these profits the company reinvests or "retains", and how effectively it does so, we are then able to assess a company’s earnings growth potential. Generally speaking, other things being equal, firms with a high return on equity and profit retention, have a higher growth rate than firms that don’t share these attributes.
Sakana's Earnings Growth And 26% ROE
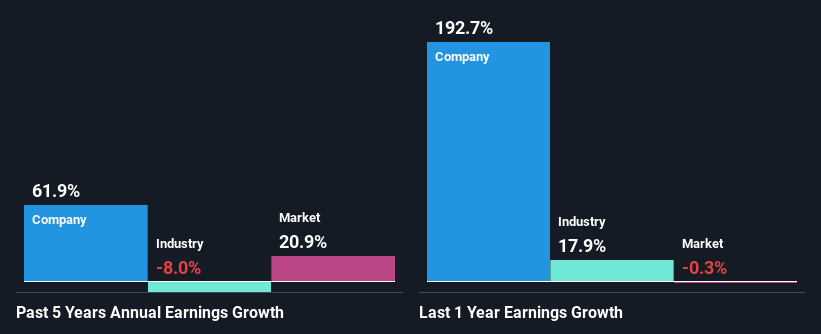
To begin with, Sakana has a pretty high ROE which is interesting. Even when compared to the industry average of 26% the company's ROE is pretty decent. As a result, Sakana's remarkable 62% net income growth seen over the past 5 years is likely aided by its high ROE.
Next, on comparing with the industry net income growth, we found that the growth figure reported by Sakana compares quite favourably to the industry average, which shows a decline of 8.0% over the last few years.
Earnings growth is an important metric to consider when valuing a stock. It’s important for an investor to know whether the market has priced in the company's expected earnings growth (or decline). This then helps them determine if the stock is placed for a bright or bleak future. Is Sakana fairly valued compared to other companies? These 3 valuation measures might help you decide.
Is Sakana Efficiently Re-investing Its Profits?
The really high three-year median payout ratio of 120% for Sakana suggests that the company is paying its shareholders more than what it is earning. Despite this, the company's earnings grew significantly as we saw above. With that said, it could be worth keeping an eye on the high payout ratio as that's a huge risk. Our risks dashboard should have the 4 risks we have identified for Sakana.
While Sakana has seen growth in its earnings, it only recently started to pay a dividend. It is most likely that the company decided to impress new and existing shareholders with a dividend.
Summary
Overall, we feel that Sakana certainly does have some positive factors to consider. Especially the growth in earnings which was backed by an impressive ROE. Still, the high ROE could have been even more beneficial to investors had the company been reinvesting more of its profits. As highlighted earlier, the current reinvestment rate appears to be negligible. Up till now, we've only made a short study of the company's growth data. You can do your own research on Sakana and see how it has performed in the past by looking at this FREE detailed graph of past earnings, revenue and cash flows.
New: Manage All Your Stock Portfolios in One Place
We've created the ultimate portfolio companion for stock investors, and it's free.
• Connect an unlimited number of Portfolios and see your total in one currency
• Be alerted to new Warning Signs or Risks via email or mobile
• Track the Fair Value of your stocks
Have feedback on this article? Concerned about the content? Get in touch with us directly. Alternatively, email editorial-team (at) simplywallst.com.
This article by Simply Wall St is general in nature. We provide commentary based on historical data and analyst forecasts only using an unbiased methodology and our articles are not intended to be financial advice. It does not constitute a recommendation to buy or sell any stock, and does not take account of your objectives, or your financial situation. We aim to bring you long-term focused analysis driven by fundamental data. Note that our analysis may not factor in the latest price-sensitive company announcements or qualitative material. Simply Wall St has no position in any stocks mentioned.
About WSE:SKN
Solid track record with excellent balance sheet.
Market Insights

Advertisement
Community Narratives
Groundbreaking therapies that could change the treatment landscape for PTSD, fibromyalgia, MS & Alzheimer’s
Fair Value US$6.20|86.9% undervalued
CM
Community Contributor
DigitalOcean Will Grow 14% by Embracing AI with Paperspace Acquisition
Fair Value US$50.00|40.2% undervalued
NE
Community Contributor
Viant Technology: A Rising AdTech Challenger in the AI-Powered CTV Market
Fair Value US$38.61|62.7% undervalued
BL
Community Contributor
Volvo will Accelerate Forward into Electric and Autonomous Leadership in Five Years
Fair Value SEK 438.80|40.1% undervalued
UN
Community Contributor