
Advertisement
- Poland
- /
- Consumer Durables
- /
- WSE:FTE
Are Investors Undervaluing Fabryki Mebli FORTE S.A. (WSE:FTE) By 29%?
Key Insights
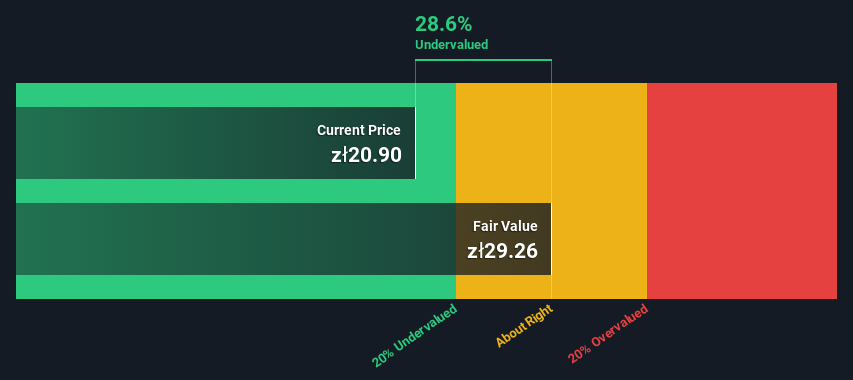
- Fabryki Mebli FORTE's estimated fair value is zł29.26 based on 2 Stage Free Cash Flow to Equity
- Fabryki Mebli FORTE is estimated to be 29% undervalued based on current share price of zł20.90
- Peers of Fabryki Mebli FORTE are currently trading on average at a 2,401% premium
In this article we are going to estimate the intrinsic value of Fabryki Mebli FORTE S.A. (WSE:FTE) by taking the expected future cash flows and discounting them to today's value. Our analysis will employ the Discounted Cash Flow (DCF) model. Models like these may appear beyond the comprehension of a lay person, but they're fairly easy to follow.
Remember though, that there are many ways to estimate a company's value, and a DCF is just one method. For those who are keen learners of equity analysis, the Simply Wall St analysis model here may be something of interest to you.
See our latest analysis for Fabryki Mebli FORTE
Is Fabryki Mebli FORTE Fairly Valued?
We're using the 2-stage growth model, which simply means we take in account two stages of company's growth. In the initial period the company may have a higher growth rate and the second stage is usually assumed to have a stable growth rate. To begin with, we have to get estimates of the next ten years of cash flows. Where possible we use analyst estimates, but when these aren't available we extrapolate the previous free cash flow (FCF) from the last estimate or reported value. We assume companies with shrinking free cash flow will slow their rate of shrinkage, and that companies with growing free cash flow will see their growth rate slow, over this period. We do this to reflect that growth tends to slow more in the early years than it does in later years.
A DCF is all about the idea that a dollar in the future is less valuable than a dollar today, so we need to discount the sum of these future cash flows to arrive at a present value estimate:
10-year free cash flow (FCF) estimate
| 2024 | 2025 | 2026 | 2027 | 2028 | 2029 | 2030 | 2031 | 2032 | 2033 | |
| Levered FCF (PLN, Millions) | zł81.0m | zł79.4m | zł79.2m | zł79.7m | zł81.0m | zł82.6m | zł84.6m | zł86.9m | zł89.4m | zł92.1m |
| Growth Rate Estimate Source | Analyst x1 | Est @ -1.93% | Est @ -0.35% | Est @ 0.74% | Est @ 1.51% | Est @ 2.05% | Est @ 2.43% | Est @ 2.69% | Est @ 2.88% | Est @ 3.01% |
| Present Value (PLN, Millions) Discounted @ 14% | zł71.4 | zł61.7 | zł54.1 | zł48.0 | zł43.0 | zł38.6 | zł34.9 | zł31.5 | zł28.6 | zł25.9 |
("Est" = FCF growth rate estimated by Simply Wall St)
Present Value of 10-year Cash Flow (PVCF) = zł438m
We now need to calculate the Terminal Value, which accounts for all the future cash flows after this ten year period. For a number of reasons a very conservative growth rate is used that cannot exceed that of a country's GDP growth. In this case we have used the 5-year average of the 10-year government bond yield (3.3%) to estimate future growth. In the same way as with the 10-year 'growth' period, we discount future cash flows to today's value, using a cost of equity of 14%.
Terminal Value (TV)= FCF2033 × (1 + g) ÷ (r – g) = zł92m× (1 + 3.3%) ÷ (14%– 3.3%) = zł933m
Present Value of Terminal Value (PVTV)= TV / (1 + r)10= zł933m÷ ( 1 + 14%)10= zł263m
The total value is the sum of cash flows for the next ten years plus the discounted terminal value, which results in the Total Equity Value, which in this case is zł700m. The last step is to then divide the equity value by the number of shares outstanding. Compared to the current share price of zł20.9, the company appears a touch undervalued at a 29% discount to where the stock price trades currently. Remember though, that this is just an approximate valuation, and like any complex formula - garbage in, garbage out.
Important Assumptions
We would point out that the most important inputs to a discounted cash flow are the discount rate and of course the actual cash flows. If you don't agree with these result, have a go at the calculation yourself and play with the assumptions. The DCF also does not consider the possible cyclicality of an industry, or a company's future capital requirements, so it does not give a full picture of a company's potential performance. Given that we are looking at Fabryki Mebli FORTE as potential shareholders, the cost of equity is used as the discount rate, rather than the cost of capital (or weighted average cost of capital, WACC) which accounts for debt. In this calculation we've used 14%, which is based on a levered beta of 1.625. Beta is a measure of a stock's volatility, compared to the market as a whole. We get our beta from the industry average beta of globally comparable companies, with an imposed limit between 0.8 and 2.0, which is a reasonable range for a stable business.
SWOT Analysis for Fabryki Mebli FORTE
Strength
- Debt is well covered by earnings.
- Dividend is in the top 25% of dividend payers in the market.
Weakness
- Earnings declined over the past year.
Opportunity
- Trading below our estimate of fair value by more than 20%.
Threat
- Debt is not well covered by operating cash flow.
Looking Ahead:
Whilst important, the DCF calculation shouldn't be the only metric you look at when researching a company. It's not possible to obtain a foolproof valuation with a DCF model. Instead the best use for a DCF model is to test certain assumptions and theories to see if they would lead to the company being undervalued or overvalued. For example, changes in the company's cost of equity or the risk free rate can significantly impact the valuation. Why is the intrinsic value higher than the current share price? For Fabryki Mebli FORTE, there are three pertinent aspects you should consider:
- Risks: As an example, we've found 4 warning signs for Fabryki Mebli FORTE (2 shouldn't be ignored!) that you need to consider before investing here.
- Future Earnings: How does FTE's growth rate compare to its peers and the wider market? Dig deeper into the analyst consensus number for the upcoming years by interacting with our free analyst growth expectation chart.
- Other Solid Businesses: Low debt, high returns on equity and good past performance are fundamental to a strong business. Why not explore our interactive list of stocks with solid business fundamentals to see if there are other companies you may not have considered!
PS. The Simply Wall St app conducts a discounted cash flow valuation for every stock on the WSE every day. If you want to find the calculation for other stocks just search here.
New: AI Stock Screener & Alerts
Our new AI Stock Screener scans the market every day to uncover opportunities.
• Dividend Powerhouses (3%+ Yield)
• Undervalued Small Caps with Insider Buying
• High growth Tech and AI Companies
Or build your own from over 50 metrics.
Have feedback on this article? Concerned about the content? Get in touch with us directly. Alternatively, email editorial-team (at) simplywallst.com.
This article by Simply Wall St is general in nature. We provide commentary based on historical data and analyst forecasts only using an unbiased methodology and our articles are not intended to be financial advice. It does not constitute a recommendation to buy or sell any stock, and does not take account of your objectives, or your financial situation. We aim to bring you long-term focused analysis driven by fundamental data. Note that our analysis may not factor in the latest price-sensitive company announcements or qualitative material. Simply Wall St has no position in any stocks mentioned.
About WSE:FTE
Fabryki Mebli FORTE
Designs, manufactures, and exports furniture worldwide.
Flawless balance sheet and fair value.
Market Insights

Advertisement
Community Narratives
MicroVision will explode future revenue by 380.37% with a vision towards success
Fair Value US$60|98.4% undervalued
TH
Community Contributor
The Indispensable Artery for a New North American Economy
Fair Value CA$132.87|0.6% undervalued
TI
Community Contributor
Recently Updated Narratives
JO


JohnJ on Worldline ·
No miracle in sight
Fair Value:€7.0178.0% undervalued
7 followersusers have followed this narrative
0 commentsusers have commented on this narrative
0 likesusers have liked this narrative
MA


MarkoVT on COVER ·
Q3 Outlook modestly optimistic
Fair Value:JP¥1.65k2.0% overvalued
1 followerusers have followed this narrative
0 commentsusers have commented on this narrative
0 likesusers have liked this narrative
BL


BlackGoat on Alphabet ·
Alphabet: The Under-appreciated Compounder Hiding in Plain Sight
Fair Value:US$324.481.3% undervalued
79 followersusers have followed this narrative
3 commentsusers have commented on this narrative
1 likeusers have liked this narrative
Popular Narratives
OS

oscargarcia on Alphabet ·
The company that turned a verb into a global necessity and basically runs the modern internet, digital ads, smartphones, maps, and AI.
Fair Value:US$3405.9% undervalued
136 followersusers have followed this narrative
6 commentsusers have commented on this narrative
18 likesusers have liked this narrative
TH

TheWallstreetKing on MicroVision ·
MicroVision will explode future revenue by 380.37% with a vision towards success
Fair Value:US$6098.4% undervalued
90 followersusers have followed this narrative
10 commentsusers have commented on this narrative
18 likesusers have liked this narrative
AN


AnalystConsensusTarget on NVIDIA ·
NVDA: Expanding AI Demand Will Drive Major Data Center Investments Through 2026
Fair Value:US$232.7922.6% undervalued
927 followersusers have followed this narrative
6 commentsusers have commented on this narrative
22 likesusers have liked this narrative