
Advertisement
- Poland
- /
- Commercial Services
- /
- WSE:PLM
What Can We Make Of Polman S.A.’s (WSE:PLM) High Return On Capital?

Today we are going to look at Polman S.A. (WSE:PLM) to see whether it might be an attractive investment prospect. Specifically, we'll consider its Return On Capital Employed (ROCE), since that will give us an insight into how efficiently the business can generate profits from the capital it requires.
First, we'll go over how we calculate ROCE. Next, we'll compare it to others in its industry. And finally, we'll look at how its current liabilities are impacting its ROCE.
Understanding Return On Capital Employed (ROCE)
ROCE is a metric for evaluating how much pre-tax income (in percentage terms) a company earns on the capital invested in its business. All else being equal, a better business will have a higher ROCE. In brief, it is a useful tool, but it is not without drawbacks. Renowned investment researcher Michael Mauboussin has suggested that a high ROCE can indicate that 'one dollar invested in the company generates value of more than one dollar'.
How Do You Calculate Return On Capital Employed?
The formula for calculating the return on capital employed is:
Return on Capital Employed = Earnings Before Interest and Tax (EBIT) ÷ (Total Assets - Current Liabilities)
Or for Polman:
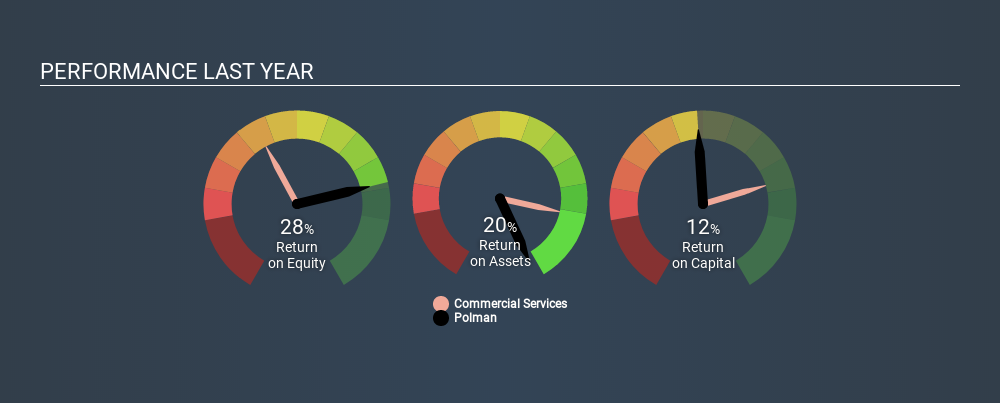
0.12 = zł1.2m ÷ (zł15m - zł3.8m) (Based on the trailing twelve months to September 2019.)
Therefore, Polman has an ROCE of 12%.
See our latest analysis for Polman
Does Polman Have A Good ROCE?
ROCE is commonly used for comparing the performance of similar businesses. In our analysis, Polman's ROCE is meaningfully higher than the 9.6% average in the Commercial Services industry. We consider this a positive sign, because it suggests it uses capital more efficiently than similar companies. Regardless of where Polman sits next to its industry, its ROCE in absolute terms appears satisfactory, and this company could be worth a closer look.
We can see that, Polman currently has an ROCE of 12%, less than the 21% it reported 3 years ago. So investors might consider if it has had issues recently. You can see in the image below how Polman's ROCE compares to its industry. Click to see more on past growth.
When considering this metric, keep in mind that it is backwards looking, and not necessarily predictive. Companies in cyclical industries can be difficult to understand using ROCE, as returns typically look high during boom times, and low during busts. ROCE is, after all, simply a snap shot of a single year. If Polman is cyclical, it could make sense to check out this free graph of past earnings, revenue and cash flow.
What Are Current Liabilities, And How Do They Affect Polman's ROCE?
Liabilities, such as supplier bills and bank overdrafts, are referred to as current liabilities if they need to be paid within 12 months. Due to the way the ROCE equation works, having large bills due in the near term can make it look as though a company has less capital employed, and thus a higher ROCE than usual. To counter this, investors can check if a company has high current liabilities relative to total assets.
Polman has total assets of zł15m and current liabilities of zł3.8m. Therefore its current liabilities are equivalent to approximately 26% of its total assets. Low current liabilities are not boosting the ROCE too much.
The Bottom Line On Polman's ROCE
This is good to see, and with a sound ROCE, Polman could be worth a closer look. There might be better investments than Polman out there, but you will have to work hard to find them . These promising businesses with rapidly growing earnings might be right up your alley.
I will like Polman better if I see some big insider buys. While we wait, check out this free list of growing companies with considerable, recent, insider buying.
If you spot an error that warrants correction, please contact the editor at editorial-team@simplywallst.com. This article by Simply Wall St is general in nature. It does not constitute a recommendation to buy or sell any stock, and does not take account of your objectives, or your financial situation. Simply Wall St has no position in the stocks mentioned.
We aim to bring you long-term focused research analysis driven by fundamental data. Note that our analysis may not factor in the latest price-sensitive company announcements or qualitative material. Thank you for reading.
About WSE:PLM
Polman
Provides various industrial cleaning services for petrochemical, chemical, power, food, and paper industries in Poland.
Excellent balance sheet low.
Market Insights


Advertisement
Community Narratives
The Future of Drug Testing? Fingerprint Tech Shows Serious Promise
Fair Value US$2.98|40.3% undervalued
JO
Community Contributor
Suncorp’s Next Chapter: Insurance-Only and Ready to Grow
Fair Value AU$22.83|7.9% undervalued
RO
Community Contributor
Thyssenkrupp Nucera Will Achieve Double-Digit Profits by 2030 Boosted by Hydrogen Growth
Fair Value €14.40|31.6% undervalued
CH
Community Contributor
Tesla’s Nvidia Moment – The AI & Robotics Inflection Point
Fair Value US$359.72|12.3% undervalued
BL
Community Contributor