
Advertisement
- Poland
- /
- Professional Services
- /
- WSE:ECN
Ecnology Group S.A.'s (WSE:ECN) Stock Has Shown Weakness Lately But Financial Prospects Look Decent: Is The Market Wrong?

With its stock down 20% over the past three months, it is easy to disregard Ecnology Group (WSE:ECN). However, the company's fundamentals look pretty decent, and long-term financials are usually aligned with future market price movements. In this article, we decided to focus on Ecnology Group's ROE.
Return on Equity or ROE is a test of how effectively a company is growing its value and managing investors’ money. In short, ROE shows the profit each dollar generates with respect to its shareholder investments.
See our latest analysis for Ecnology Group
How To Calculate Return On Equity?
Return on equity can be calculated by using the formula:
Return on Equity = Net Profit (from continuing operations) ÷ Shareholders' Equity
So, based on the above formula, the ROE for Ecnology Group is:
23% = zł280k ÷ zł1.2m (Based on the trailing twelve months to December 2023).
The 'return' is the yearly profit. So, this means that for every PLN1 of its shareholder's investments, the company generates a profit of PLN0.23.
What Is The Relationship Between ROE And Earnings Growth?
We have already established that ROE serves as an efficient profit-generating gauge for a company's future earnings. Based on how much of its profits the company chooses to reinvest or "retain", we are then able to evaluate a company's future ability to generate profits. Assuming everything else remains unchanged, the higher the ROE and profit retention, the higher the growth rate of a company compared to companies that don't necessarily bear these characteristics.
Ecnology Group's Earnings Growth And 23% ROE
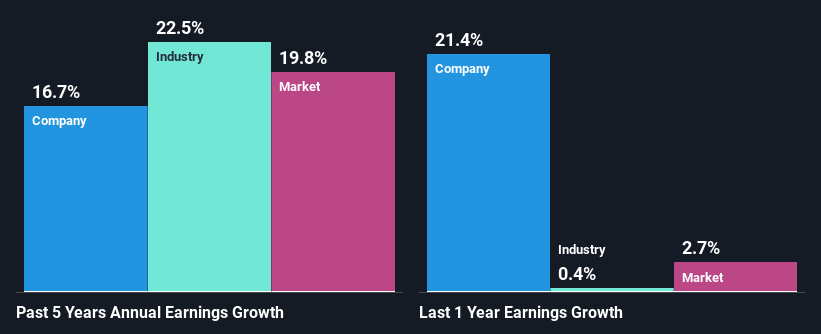
To begin with, Ecnology Group seems to have a respectable ROE. Further, the company's ROE compares quite favorably to the industry average of 19%. This certainly adds some context to Ecnology Group's decent 17% net income growth seen over the past five years.
Next, on comparing with the industry net income growth, we found that Ecnology Group's reported growth was lower than the industry growth of 22% over the last few years, which is not something we like to see.
Earnings growth is an important metric to consider when valuing a stock. What investors need to determine next is if the expected earnings growth, or the lack of it, is already built into the share price. By doing so, they will have an idea if the stock is headed into clear blue waters or if swampy waters await. If you're wondering about Ecnology Group's's valuation, check out this gauge of its price-to-earnings ratio, as compared to its industry.
Is Ecnology Group Efficiently Re-investing Its Profits?
Ecnology Group's high three-year median payout ratio of 105% suggests that the company is paying out more to its shareholders than what it is making. However, this hasn't really hampered its ability to grow as we saw earlier. That being said, the high payout ratio could be worth keeping an eye on in case the company is unable to keep up its current growth momentum. Our risks dashboard should have the 4 risks we have identified for Ecnology Group.
Moreover, Ecnology Group is determined to keep sharing its profits with shareholders which we infer from its long history of eight years of paying a dividend.
Conclusion
On the whole, we do feel that Ecnology Group has some positive attributes. The company has grown its earnings moderately as a result of its impressive ROE. Yet, the business is retaining hardly any of its profits. This might have negative implications on the company's future growth. So far, we've only made a quick discussion around the company's earnings growth. To gain further insights into Ecnology Group's past profit growth, check out this visualization of past earnings, revenue and cash flows.
Valuation is complex, but we're here to simplify it.
Discover if Ecnology Group might be undervalued or overvalued with our detailed analysis, featuring fair value estimates, potential risks, dividends, insider trades, and its financial condition.
Access Free AnalysisHave feedback on this article? Concerned about the content? Get in touch with us directly. Alternatively, email editorial-team (at) simplywallst.com.
This article by Simply Wall St is general in nature. We provide commentary based on historical data and analyst forecasts only using an unbiased methodology and our articles are not intended to be financial advice. It does not constitute a recommendation to buy or sell any stock, and does not take account of your objectives, or your financial situation. We aim to bring you long-term focused analysis driven by fundamental data. Note that our analysis may not factor in the latest price-sensitive company announcements or qualitative material. Simply Wall St has no position in any stocks mentioned.
About WSE:ECN
Ecnology Group
Engages in the provision of financial consultancy services in Poland.
Flawless balance sheet slight.
Market Insights


Advertisement
Community Narratives
The Future of Drug Testing? Fingerprint Tech Shows Serious Promise
Fair Value US$2.98|43.0% undervalued
JO
Community Contributor
Suncorp’s Next Chapter: Insurance-Only and Ready to Grow
Fair Value AU$22.83|7.6% undervalued
RO
Community Contributor
Thyssenkrupp Nucera Will Achieve Double-Digit Profits by 2030 Boosted by Hydrogen Growth
Fair Value €14.40|30.6% undervalued
CH
Community Contributor
Tesla’s Nvidia Moment – The AI & Robotics Inflection Point
Fair Value US$359.72|18.3% undervalued
BL
Community Contributor