- Poland
- /
- Electrical
- /
- WSE:PEN
Market Cool On Photon Energy N.V.'s (WSE:PEN) Revenues Pushing Shares 25% Lower

To the annoyance of some shareholders, Photon Energy N.V. (WSE:PEN) shares are down a considerable 25% in the last month, which continues a horrid run for the company. The drop over the last 30 days has capped off a tough year for shareholders, with the share price down 48% in that time.
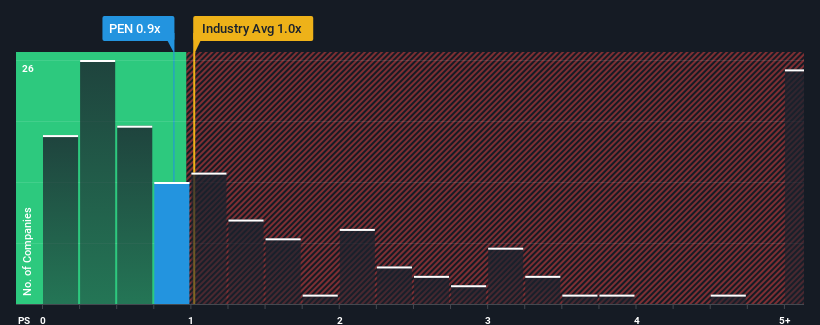
In spite of the heavy fall in price, it's still not a stretch to say that Photon Energy's price-to-sales (or "P/S") ratio of 0.9x right now seems quite "middle-of-the-road" compared to the Electrical industry in Poland, where the median P/S ratio is around 0.7x. Although, it's not wise to simply ignore the P/S without explanation as investors may be disregarding a distinct opportunity or a costly mistake.
Check out our latest analysis for Photon Energy

How Has Photon Energy Performed Recently?
Photon Energy has been struggling lately as its revenue has declined faster than most other companies. Perhaps the market is expecting future revenue performance to begin matching the rest of the industry, which has kept the P/S from declining. If you still like the company, you'd want its revenue trajectory to turn around before making any decisions. If not, then existing shareholders may be a little nervous about the viability of the share price.
Keen to find out how analysts think Photon Energy's future stacks up against the industry? In that case, our free report is a great place to start.Is There Some Revenue Growth Forecasted For Photon Energy?
Photon Energy's P/S ratio would be typical for a company that's only expected to deliver moderate growth, and importantly, perform in line with the industry.
In reviewing the last year of financials, we were disheartened to see the company's revenues fell to the tune of 30%. However, a few very strong years before that means that it was still able to grow revenue by an impressive 152% in total over the last three years. Accordingly, while they would have preferred to keep the run going, shareholders would definitely welcome the medium-term rates of revenue growth.
Looking ahead now, revenue is anticipated to climb by 12% each year during the coming three years according to the two analysts following the company. With the industry only predicted to deliver 8.7% each year, the company is positioned for a stronger revenue result.
In light of this, it's curious that Photon Energy's P/S sits in line with the majority of other companies. Apparently some shareholders are skeptical of the forecasts and have been accepting lower selling prices.
What Does Photon Energy's P/S Mean For Investors?
With its share price dropping off a cliff, the P/S for Photon Energy looks to be in line with the rest of the Electrical industry. Generally, our preference is to limit the use of the price-to-sales ratio to establishing what the market thinks about the overall health of a company.
Looking at Photon Energy's analyst forecasts revealed that its superior revenue outlook isn't giving the boost to its P/S that we would've expected. When we see a strong revenue outlook, with growth outpacing the industry, we can only assume potential uncertainty around these figures are what might be placing slight pressure on the P/S ratio. However, if you agree with the analysts' forecasts, you may be able to pick up the stock at an attractive price.
It is also worth noting that we have found 2 warning signs for Photon Energy that you need to take into consideration.
It's important to make sure you look for a great company, not just the first idea you come across. So if growing profitability aligns with your idea of a great company, take a peek at this free list of interesting companies with strong recent earnings growth (and a low P/E).
New: Manage All Your Stock Portfolios in One Place
We've created the ultimate portfolio companion for stock investors, and it's free.
• Connect an unlimited number of Portfolios and see your total in one currency
• Be alerted to new Warning Signs or Risks via email or mobile
• Track the Fair Value of your stocks
Have feedback on this article? Concerned about the content? Get in touch with us directly. Alternatively, email editorial-team (at) simplywallst.com.
This article by Simply Wall St is general in nature. We provide commentary based on historical data and analyst forecasts only using an unbiased methodology and our articles are not intended to be financial advice. It does not constitute a recommendation to buy or sell any stock, and does not take account of your objectives, or your financial situation. We aim to bring you long-term focused analysis driven by fundamental data. Note that our analysis may not factor in the latest price-sensitive company announcements or qualitative material. Simply Wall St has no position in any stocks mentioned.
About WSE:PEN
Photon Energy
Through its subsidiaries, provides solar power solutions and services in the Netherlands, the Czech Republic, Hungary, Poland, Australia, Romania, Slovak Republic, and Germany.
Fair value with mediocre balance sheet.


