We Like These Underlying Return On Capital Trends At Newag (WSE:NWG)


If we want to find a potential multi-bagger, often there are underlying trends that can provide clues. One common approach is to try and find a company with returns on capital employed (ROCE) that are increasing, in conjunction with a growing amount of capital employed. This shows us that it's a compounding machine, able to continually reinvest its earnings back into the business and generate higher returns. Speaking of which, we noticed some great changes in Newag's (WSE:NWG) returns on capital, so let's have a look.
Understanding Return On Capital Employed (ROCE)
Just to clarify if you're unsure, ROCE is a metric for evaluating how much pre-tax income (in percentage terms) a company earns on the capital invested in its business. The formula for this calculation on Newag is:
Return on Capital Employed = Earnings Before Interest and Tax (EBIT) ÷ (Total Assets - Current Liabilities)
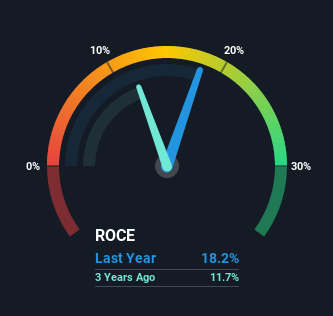
0.18 = zł171m ÷ (zł1.7b - zł735m) (Based on the trailing twelve months to September 2021).
So, Newag has an ROCE of 18%. On its own, that's a standard return, however it's much better than the 8.0% generated by the Machinery industry.
Check out our latest analysis for Newag
Above you can see how the current ROCE for Newag compares to its prior returns on capital, but there's only so much you can tell from the past. If you'd like to see what analysts are forecasting going forward, you should check out our free report for Newag.
What Can We Tell From Newag's ROCE Trend?
Investors would be pleased with what's happening at Newag. The data shows that returns on capital have increased substantially over the last five years to 18%. Basically the business is earning more per dollar of capital invested and in addition to that, 78% more capital is being employed now too. This can indicate that there's plenty of opportunities to invest capital internally and at ever higher rates, a combination that's common among multi-baggers.
On a separate but related note, it's important to know that Newag has a current liabilities to total assets ratio of 44%, which we'd consider pretty high. This can bring about some risks because the company is basically operating with a rather large reliance on its suppliers or other sorts of short-term creditors. Ideally we'd like to see this reduce as that would mean fewer obligations bearing risks.
In Conclusion...
A company that is growing its returns on capital and can consistently reinvest in itself is a highly sought after trait, and that's what Newag has. Considering the stock has delivered 25% to its stockholders over the last five years, it may be fair to think that investors aren't fully aware of the promising trends yet. So exploring more about this stock could uncover a good opportunity, if the valuation and other metrics stack up.
Newag does come with some risks though, we found 2 warning signs in our investment analysis, and 1 of those doesn't sit too well with us...
While Newag isn't earning the highest return, check out this free list of companies that are earning high returns on equity with solid balance sheets.
Valuation is complex, but we're here to simplify it.
Discover if Newag might be undervalued or overvalued with our detailed analysis, featuring fair value estimates, potential risks, dividends, insider trades, and its financial condition.
Access Free AnalysisHave feedback on this article? Concerned about the content? Get in touch with us directly. Alternatively, email editorial-team (at) simplywallst.com.
This article by Simply Wall St is general in nature. We provide commentary based on historical data and analyst forecasts only using an unbiased methodology and our articles are not intended to be financial advice. It does not constitute a recommendation to buy or sell any stock, and does not take account of your objectives, or your financial situation. We aim to bring you long-term focused analysis driven by fundamental data. Note that our analysis may not factor in the latest price-sensitive company announcements or qualitative material. Simply Wall St has no position in any stocks mentioned.
About WSE:NWG
Newag
Engages in the production and sale of railway locomotives and rolling stocks in Poland.
Flawless balance sheet with proven track record.
Market Insights

Community Narratives


