

Warren Buffett famously said, 'Volatility is far from synonymous with risk.' When we think about how risky a company is, we always like to look at its use of debt, since debt overload can lead to ruin. We can see that APS Energia SA (WSE:APE) does use debt in its business. But the real question is whether this debt is making the company risky.
Why Does Debt Bring Risk?
Debt is a tool to help businesses grow, but if a business is incapable of paying off its lenders, then it exists at their mercy. If things get really bad, the lenders can take control of the business. However, a more frequent (but still costly) occurrence is where a company must issue shares at bargain-basement prices, permanently diluting shareholders, just to shore up its balance sheet. Of course, the upside of debt is that it often represents cheap capital, especially when it replaces dilution in a company with the ability to reinvest at high rates of return. When we think about a company's use of debt, we first look at cash and debt together.
How Much Debt Does APS Energia Carry?
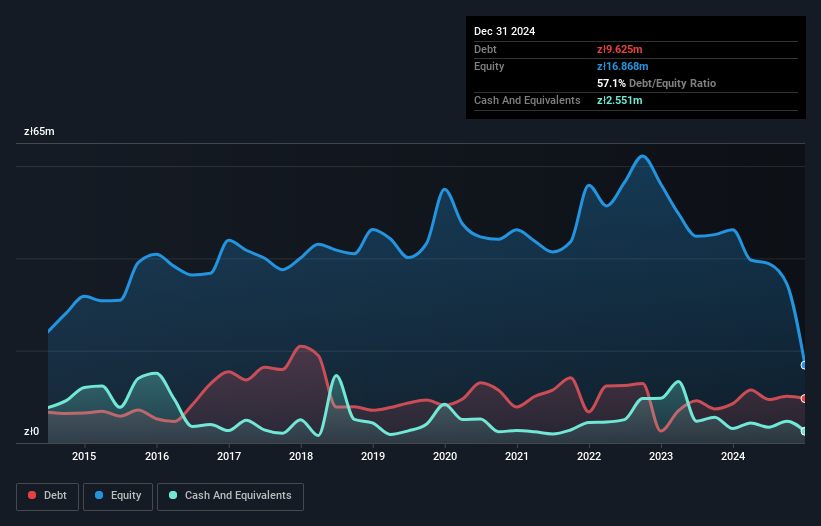
As you can see below, at the end of December 2024, APS Energia had zł9.63m of debt, up from zł8.54m a year ago. Click the image for more detail. However, it does have zł2.55m in cash offsetting this, leading to net debt of about zł7.07m.
How Healthy Is APS Energia's Balance Sheet?
According to the last reported balance sheet, APS Energia had liabilities of zł56.8m due within 12 months, and liabilities of zł8.25m due beyond 12 months. Offsetting these obligations, it had cash of zł2.55m as well as receivables valued at zł18.1m due within 12 months. So its liabilities total zł44.4m more than the combination of its cash and short-term receivables.
While this might seem like a lot, it is not so bad since APS Energia has a market capitalization of zł105.7m, and so it could probably strengthen its balance sheet by raising capital if it needed to. However, it is still worthwhile taking a close look at its ability to pay off debt. When analysing debt levels, the balance sheet is the obvious place to start. But it is APS Energia's earnings that will influence how the balance sheet holds up in the future. So if you're keen to discover more about its earnings, it might be worth checking out this graph of its long term earnings trend.
View our latest analysis for APS Energia
In the last year APS Energia had a loss before interest and tax, and actually shrunk its revenue by 21%, to zł100m. To be frank that doesn't bode well.
Caveat Emptor
Not only did APS Energia's revenue slip over the last twelve months, but it also produced negative earnings before interest and tax (EBIT). Its EBIT loss was a whopping zł18m. Considering that alongside the liabilities mentioned above does not give us much confidence that company should be using so much debt. So we think its balance sheet is a little strained, though not beyond repair. However, it doesn't help that it burned through zł251k of cash over the last year. So to be blunt we think it is risky. When analysing debt levels, the balance sheet is the obvious place to start. But ultimately, every company can contain risks that exist outside of the balance sheet. These risks can be hard to spot. Every company has them, and we've spotted 3 warning signs for APS Energia (of which 1 is a bit unpleasant!) you should know about.
If you're interested in investing in businesses that can grow profits without the burden of debt, then check out this free list of growing businesses that have net cash on the balance sheet.
If you're looking to trade APS Energia, open an account with the lowest-cost platform trusted by professionals, Interactive Brokers.
With clients in over 200 countries and territories, and access to 160 markets, IBKR lets you trade stocks, options, futures, forex, bonds and funds from a single integrated account.
Enjoy no hidden fees, no account minimums, and FX conversion rates as low as 0.03%, far better than what most brokers offer.
Sponsored ContentNew: Manage All Your Stock Portfolios in One Place
We've created the ultimate portfolio companion for stock investors, and it's free.
• Connect an unlimited number of Portfolios and see your total in one currency
• Be alerted to new Warning Signs or Risks via email or mobile
• Track the Fair Value of your stocks
Have feedback on this article? Concerned about the content? Get in touch with us directly. Alternatively, email editorial-team (at) simplywallst.com.
This article by Simply Wall St is general in nature. We provide commentary based on historical data and analyst forecasts only using an unbiased methodology and our articles are not intended to be financial advice. It does not constitute a recommendation to buy or sell any stock, and does not take account of your objectives, or your financial situation. We aim to bring you long-term focused analysis driven by fundamental data. Note that our analysis may not factor in the latest price-sensitive company announcements or qualitative material. Simply Wall St has no position in any stocks mentioned.
About WSE:APE
APS Energia
Designs, produces, and sells uninterruptible power supply systems for the production, heating, industry, telecommunications, medicine, and other sectors worldwide.
Low with imperfect balance sheet.
Market Insights

Community Narratives

