
Advertisement
- New Zealand
- /
- Other Utilities
- /
- NZSE:VCT
Vector Limited's (NZSE:VCT) Financial Prospects Don't Look Very Positive: Could It Mean A Stock Price Drop In The Future?
Vector's (NZSE:VCT) stock up by 2.7% over the past week. However, its weak financial performance indicators makes us a bit doubtful if that trend could continue. Particularly, we will be paying attention to Vector's ROE today.
Return on Equity or ROE is a test of how effectively a company is growing its value and managing investors’ money. Put another way, it reveals the company's success at turning shareholder investments into profits.
See our latest analysis for Vector
How To Calculate Return On Equity?
The formula for ROE is:
Return on Equity = Net Profit (from continuing operations) ÷ Shareholders' Equity
So, based on the above formula, the ROE for Vector is:
1.9% = NZ$71m ÷ NZ$3.8b (Based on the trailing twelve months to December 2023).
The 'return' is the profit over the last twelve months. Another way to think of that is that for every NZ$1 worth of equity, the company was able to earn NZ$0.02 in profit.
Why Is ROE Important For Earnings Growth?
Thus far, we have learned that ROE measures how efficiently a company is generating its profits. We now need to evaluate how much profit the company reinvests or "retains" for future growth which then gives us an idea about the growth potential of the company. Generally speaking, other things being equal, firms with a high return on equity and profit retention, have a higher growth rate than firms that don’t share these attributes.
Vector's Earnings Growth And 1.9% ROE
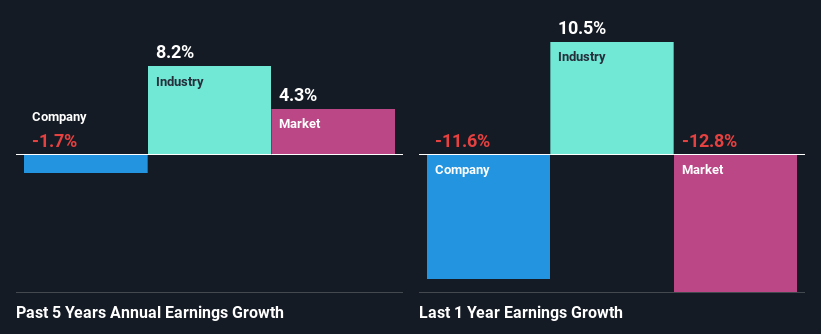
It is hard to argue that Vector's ROE is much good in and of itself. Even compared to the average industry ROE of 9.5%, the company's ROE is quite dismal. As a result, Vector's flat earnings over the past five years doesn't come as a surprise given its lower ROE.
As a next step, we compared Vector's net income growth with the industry and discovered that the industry saw an average growth of 8.2% in the same period.
Earnings growth is a huge factor in stock valuation. The investor should try to establish if the expected growth or decline in earnings, whichever the case may be, is priced in. This then helps them determine if the stock is placed for a bright or bleak future. Is VCT fairly valued? This infographic on the company's intrinsic value has everything you need to know.
Is Vector Efficiently Re-investing Its Profits?
Vector has a very high three-year median payout ratio of 146% over the last last three years, which suggests that the company is dipping into more than just its earnings to pay its dividend. This does go some way in explaining the negligible earnings growth seen by Vector. Paying a dividend higher than reported profits is not a sustainable move. This is indicative of risk. Our risks dashboard should have the 3 risks we have identified for Vector.
Additionally, Vector has paid dividends over a period of at least ten years, which means that the company's management is determined to pay dividends even if it means little to no earnings growth. Upon studying the latest analysts' consensus data, we found that the company's future payout ratio is expected to drop to 77% over the next three years. As a result, the expected drop in Vector's payout ratio explains the anticipated rise in the company's future ROE to 6.7%, over the same period.
Conclusion
On the whole, Vector's performance is quite a big let-down. The low ROE, combined with the fact that the company is paying out almost if not all, of its profits as dividends, has resulted in the lack or absence of growth in its earnings. Having said that, looking at current analyst estimates, we found that the company's earnings growth rate is expected to see a huge improvement. To know more about the latest analysts predictions for the company, check out this visualization of analyst forecasts for the company.
New: Manage All Your Stock Portfolios in One Place
We've created the ultimate portfolio companion for stock investors, and it's free.
• Connect an unlimited number of Portfolios and see your total in one currency
• Be alerted to new Warning Signs or Risks via email or mobile
• Track the Fair Value of your stocks
Have feedback on this article? Concerned about the content? Get in touch with us directly. Alternatively, email editorial-team (at) simplywallst.com.
This article by Simply Wall St is general in nature. We provide commentary based on historical data and analyst forecasts only using an unbiased methodology and our articles are not intended to be financial advice. It does not constitute a recommendation to buy or sell any stock, and does not take account of your objectives, or your financial situation. We aim to bring you long-term focused analysis driven by fundamental data. Note that our analysis may not factor in the latest price-sensitive company announcements or qualitative material. Simply Wall St has no position in any stocks mentioned.
About NZSE:VCT
Vector
Engages in electricity and gas distribution, telecommunication and new energy solutions businesses in New Zealand.
Proven track record and fair value.
Similar Companies
Market Insights

Advertisement
Community Narratives
The company that turned a verb into a global necessity and basically runs the modern internet, digital ads, smartphones, maps, and AI.
Fair Value US$300.00|8.5% undervalued
OS
Community Contributor
Flowers Foods Pays A Fair Price For Health
Fair Value US$16.12|24.6% undervalued
NV
Community Contributor
TMX Group will thrive with 33.3% profit margin and enduring market moat
Fair Value CA$49.90|0.1% undervalued
LI
Community Contributor