- New Zealand
- /
- REITS
- /
- NZSE:SPG
Stride Property Group (NZSE:SPG) shareholders have lost 31% over 1 year, earnings decline likely the culprit


Investors can approximate the average market return by buying an index fund. But if you buy individual stocks, you can do both better or worse than that. For example, the Stride Property Group (NZSE:SPG) share price is down 35% in the last year. That contrasts poorly with the market decline of 15%. Notably, shareholders had a tough run over the longer term, too, with a drop of 32% in the last three years. Unfortunately the share price momentum is still quite negative, with prices down 12% in thirty days. However, we note the price may have been impacted by the broader market, which is down 5.0% in the same time period.
Given the past week has been tough on shareholders, let's investigate the fundamentals and see what we can learn.
Though if you're not interested in researching what drove SPG's performance, we have a free list of interesting investing ideas to potentially inspire your next investment!
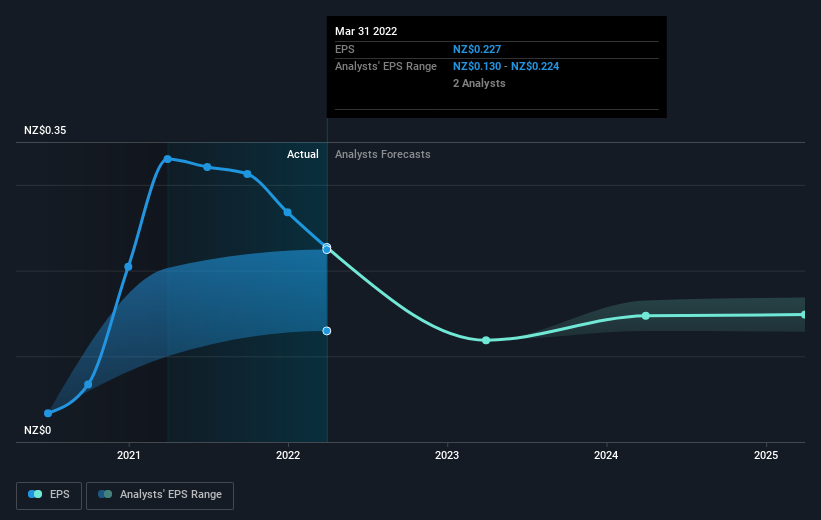
To paraphrase Benjamin Graham: Over the short term the market is a voting machine, but over the long term it's a weighing machine. One way to examine how market sentiment has changed over time is to look at the interaction between a company's share price and its earnings per share (EPS).
Unhappily, Stride Property Group had to report a 31% decline in EPS over the last year. We note that the 35% share price drop is very close to the EPS drop. So it seems that the market sentiment has not changed much, despite the weak results. Rather, the share price is remains a similar multiple of the EPS, suggesting the outlook remains the same.
You can see how EPS has changed over time in the image below (click on the chart to see the exact values).
Before buying or selling a stock, we always recommend a close examination of historic growth trends, available here.
What About Dividends?
When looking at investment returns, it is important to consider the difference between total shareholder return (TSR) and share price return. The TSR incorporates the value of any spin-offs or discounted capital raisings, along with any dividends, based on the assumption that the dividends are reinvested. So for companies that pay a generous dividend, the TSR is often a lot higher than the share price return. In the case of Stride Property Group, it has a TSR of -31% for the last 1 year. That exceeds its share price return that we previously mentioned. This is largely a result of its dividend payments!
A Different Perspective
While the broader market lost about 15% in the twelve months, Stride Property Group shareholders did even worse, losing 31% (even including dividends). Having said that, it's inevitable that some stocks will be oversold in a falling market. The key is to keep your eyes on the fundamental developments. Longer term investors wouldn't be so upset, since they would have made 5%, each year, over five years. It could be that the recent sell-off is an opportunity, so it may be worth checking the fundamental data for signs of a long term growth trend. I find it very interesting to look at share price over the long term as a proxy for business performance. But to truly gain insight, we need to consider other information, too. Take risks, for example - Stride Property Group has 4 warning signs (and 2 which are a bit unpleasant) we think you should know about.
Of course Stride Property Group may not be the best stock to buy. So you may wish to see this free collection of growth stocks.
Please note, the market returns quoted in this article reflect the market weighted average returns of stocks that currently trade on NZ exchanges.
New: Manage All Your Stock Portfolios in One Place
We've created the ultimate portfolio companion for stock investors, and it's free.
• Connect an unlimited number of Portfolios and see your total in one currency
• Be alerted to new Warning Signs or Risks via email or mobile
• Track the Fair Value of your stocks
Have feedback on this article? Concerned about the content? Get in touch with us directly. Alternatively, email editorial-team (at) simplywallst.com.
This article by Simply Wall St is general in nature. We provide commentary based on historical data and analyst forecasts only using an unbiased methodology and our articles are not intended to be financial advice. It does not constitute a recommendation to buy or sell any stock, and does not take account of your objectives, or your financial situation. We aim to bring you long-term focused analysis driven by fundamental data. Note that our analysis may not factor in the latest price-sensitive company announcements or qualitative material. Simply Wall St has no position in any stocks mentioned.
About NZSE:SPG
Stride Property Group
Stride Stapled Group is a real estate investment firm specializing in co-investments and investments in commercial, retail, and industrial real estate properties.
Fair value with mediocre balance sheet.
Market Insights

Community Narratives

