- New Zealand
- /
- Building
- /
- NZSE:FBU
Did Changing Sentiment Drive Fletcher Building's (NZSE:FBU) Share Price Down By 49%?

Ideally, your overall portfolio should beat the market average. But every investor is virtually certain to have both over-performing and under-performing stocks. So we wouldn't blame long term Fletcher Building Limited (NZSE:FBU) shareholders for doubting their decision to hold, with the stock down 49% over a half decade. And it's not just long term holders hurting, because the stock is down 24% in the last year. There was little comfort for shareholders in the last week as the price declined a further 3.0%.
See our latest analysis for Fletcher Building
While the efficient markets hypothesis continues to be taught by some, it has been proven that markets are over-reactive dynamic systems, and investors are not always rational. By comparing earnings per share (EPS) and share price changes over time, we can get a feel for how investor attitudes to a company have morphed over time.
Fletcher Building became profitable within the last five years. That would generally be considered a positive, so we are surprised to see the share price is down. Other metrics may better explain the share price move.
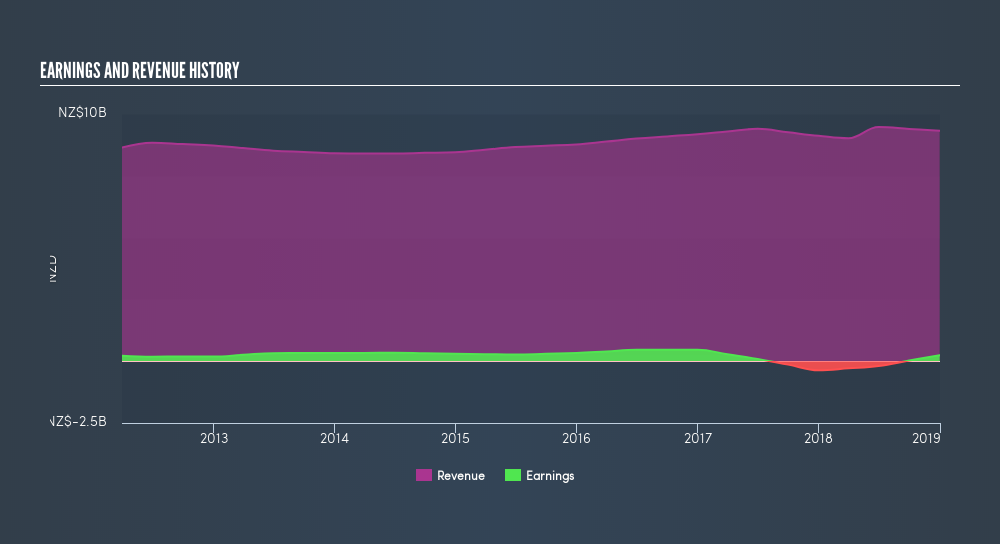
In contrast to the share price, revenue has actually increased by 2.6% a year in the five year period. So it seems one might have to take closer look at the fundamentals to understand why the share price languishes. After all, there may be an opportunity.
The chart below shows how revenue and earnings have changed with time, (if you click on the chart you can see the actual values).

Fletcher Building is a well known stock, with plenty of analyst coverage, suggesting some visibility into future growth. If you are thinking of buying or selling Fletcher Building stock, you should check out this freereport showing analyst consensus estimates for future profits.
What About Dividends?
When looking at investment returns, it is important to consider the difference between total shareholder return (TSR) and share price return. The TSR is a return calculation that accounts for the value of cash dividends (assuming that any dividend received was reinvested) and the calculated value of any discounted capital raisings. It's fair to say that the TSR gives a more complete picture for stocks that pay a dividend. We note that for Fletcher Building the TSR over the last 5 years was -35%, which is better than the share price return mentioned above. This is largely a result of its dividend payments!
A Different Perspective
While the broader market gained around 12% in the last year, Fletcher Building shareholders lost 21% (even including dividends). Even the share prices of good stocks drop sometimes, but we want to see improvements in the fundamental metrics of a business, before getting too interested. Regrettably, last year's performance caps off a bad run, with the shareholders facing a total loss of 8.4% per year over five years. We realise that Buffett has said investors should 'buy when there is blood on the streets', but we caution that investors should first be sure they are buying a high quality businesses. Importantly, we haven't analysed Fletcher Building's dividend history. This freevisual report on its dividends is a must-read if you're thinking of buying.
If you would prefer to check out another company -- one with potentially superior financials -- then do not miss this freelist of companies that have proven they can grow earnings.
Please note, the market returns quoted in this article reflect the market weighted average returns of stocks that currently trade on NZ exchanges.We aim to bring you long-term focused research analysis driven by fundamental data. Note that our analysis may not factor in the latest price-sensitive company announcements or qualitative material.
If you spot an error that warrants correction, please contact the editor at editorial-team@simplywallst.com. This article by Simply Wall St is general in nature. It does not constitute a recommendation to buy or sell any stock, and does not take account of your objectives, or your financial situation. Simply Wall St has no position in the stocks mentioned. Thank you for reading.
About NZSE:FBU
Fletcher Building
Engages in the manufacture and distribution of building products in New Zealand, Australia, and internationally.
Good value with adequate balance sheet.
Similar Companies
Market Insights
Community Narratives


