- New Zealand
- /
- Medical Equipment
- /
- NZSE:TRU
Here's Why We're Not Too Worried About TruScreen Group's (NZSE:TRU) Cash Burn Situation

Just because a business does not make any money, does not mean that the stock will go down. For example, although Amazon.com made losses for many years after listing, if you had bought and held the shares since 1999, you would have made a fortune. Having said that, unprofitable companies are risky because they could potentially burn through all their cash and become distressed.
So should TruScreen Group (NZSE:TRU) shareholders be worried about its cash burn? In this article, we define cash burn as its annual (negative) free cash flow, which is the amount of money a company spends each year to fund its growth. First, we'll determine its cash runway by comparing its cash burn with its cash reserves.
View our latest analysis for TruScreen Group
How Long Is TruScreen Group's Cash Runway?
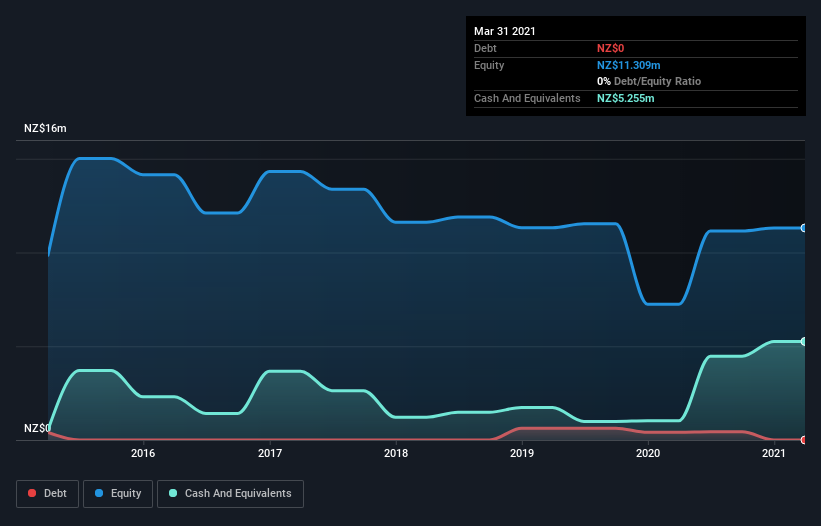
A company's cash runway is calculated by dividing its cash hoard by its cash burn. As at March 2021, TruScreen Group had cash of NZ$5.3m and no debt. In the last year, its cash burn was NZ$2.3m. Therefore, from March 2021 it had 2.3 years of cash runway. Arguably, that's a prudent and sensible length of runway to have. Depicted below, you can see how its cash holdings have changed over time.

How Is TruScreen Group's Cash Burn Changing Over Time?
In the last year, TruScreen Group did book revenue of NZ$2.0m, but its revenue from operations was less, at just NZ$1.1m. Given how low that operating leverage is, we think it's too early to put much weight on the revenue growth, so we'll focus on how the cash burn is changing, instead. With the cash burn rate up 40% in the last year, it seems that the company is ratcheting up investment in the business over time. That's not necessarily a bad thing, but investors should be mindful of the fact that will shorten the cash runway. Admittedly, we're a bit cautious of TruScreen Group due to its lack of significant operating revenues. So we'd generally prefer stocks from this list of stocks that have analysts forecasting growth.
Can TruScreen Group Raise More Cash Easily?
Given its cash burn trajectory, TruScreen Group shareholders may wish to consider how easily it could raise more cash, despite its solid cash runway. Companies can raise capital through either debt or equity. Many companies end up issuing new shares to fund future growth. We can compare a company's cash burn to its market capitalisation to get a sense for how many new shares a company would have to issue to fund one year's operations.
TruScreen Group has a market capitalisation of NZ$32m and burnt through NZ$2.3m last year, which is 7.1% of the company's market value. Given that is a rather small percentage, it would probably be really easy for the company to fund another year's growth by issuing some new shares to investors, or even by taking out a loan.
How Risky Is TruScreen Group's Cash Burn Situation?
As you can probably tell by now, we're not too worried about TruScreen Group's cash burn. In particular, we think its cash runway stands out as evidence that the company is well on top of its spending. While its increasing cash burn wasn't great, the other factors mentioned in this article more than make up for weakness on that measure. Considering all the factors discussed in this article, we're not overly concerned about the company's cash burn, although we do think shareholders should keep an eye on how it develops. Taking a deeper dive, we've spotted 5 warning signs for TruScreen Group you should be aware of, and 1 of them is a bit unpleasant.
If you would prefer to check out another company with better fundamentals, then do not miss this free list of interesting companies, that have HIGH return on equity and low debt or this list of stocks which are all forecast to grow.
Valuation is complex, but we're here to simplify it.
Discover if TruScreen Group might be undervalued or overvalued with our detailed analysis, featuring fair value estimates, potential risks, dividends, insider trades, and its financial condition.
Access Free AnalysisThis article by Simply Wall St is general in nature. We provide commentary based on historical data and analyst forecasts only using an unbiased methodology and our articles are not intended to be financial advice. It does not constitute a recommendation to buy or sell any stock, and does not take account of your objectives, or your financial situation. We aim to bring you long-term focused analysis driven by fundamental data. Note that our analysis may not factor in the latest price-sensitive company announcements or qualitative material. Simply Wall St has no position in any stocks mentioned.
Have feedback on this article? Concerned about the content? Get in touch with us directly. Alternatively, email editorial-team (at) simplywallst.com.
About NZSE:TRU
TruScreen Group
Develops, manufacture, and sale of cancer detection devices and systems in Mexico, China, Russia, Vietnam, Zimbabwe, Eastern Europe, the Middle East/North Africa, and internationally.
Flawless balance sheet low.
Market Insights
Community Narratives


