
Advertisement
- New Zealand
- /
- Healthcare Services
- /
- NZSE:EBO
Is EBOS Group Limited's (NZSE:EBO) Recent Stock Performance Tethered To Its Strong Fundamentals?

Most readers would already be aware that EBOS Group's (NZSE:EBO) stock increased significantly by 12% over the past month. Given the company's impressive performance, we decided to study its financial indicators more closely as a company's financial health over the long-term usually dictates market outcomes. Specifically, we decided to study EBOS Group's ROE in this article.
ROE or return on equity is a useful tool to assess how effectively a company can generate returns on the investment it received from its shareholders. In other words, it is a profitability ratio which measures the rate of return on the capital provided by the company's shareholders.
See our latest analysis for EBOS Group
How To Calculate Return On Equity?
Return on equity can be calculated by using the formula:
Return on Equity = Net Profit (from continuing operations) ÷ Shareholders' Equity
So, based on the above formula, the ROE for EBOS Group is:
11% = AU$263m ÷ AU$2.3b (Based on the trailing twelve months to June 2023).
The 'return' is the profit over the last twelve months. That means that for every NZ$1 worth of shareholders' equity, the company generated NZ$0.11 in profit.
What Is The Relationship Between ROE And Earnings Growth?
Thus far, we have learned that ROE measures how efficiently a company is generating its profits. Depending on how much of these profits the company reinvests or "retains", and how effectively it does so, we are then able to assess a company’s earnings growth potential. Assuming everything else remains unchanged, the higher the ROE and profit retention, the higher the growth rate of a company compared to companies that don't necessarily bear these characteristics.
EBOS Group's Earnings Growth And 11% ROE
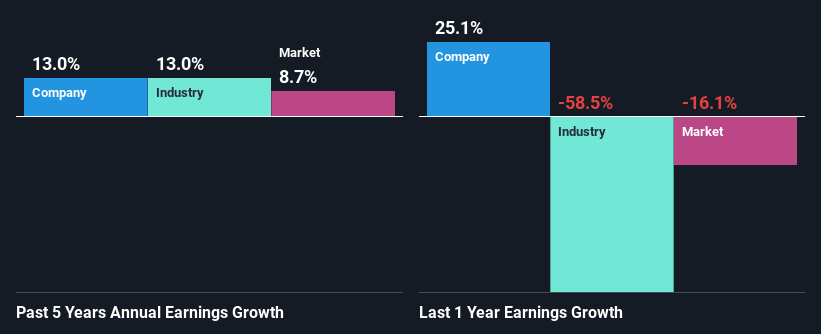
To start with, EBOS Group's ROE looks acceptable. Especially when compared to the industry average of 5.9% the company's ROE looks pretty impressive. This certainly adds some context to EBOS Group's decent 13% net income growth seen over the past five years.
Next, on comparing EBOS Group's net income growth with the industry, we found that the company's reported growth is similar to the industry average growth rate of 13% over the last few years.
Earnings growth is a huge factor in stock valuation. What investors need to determine next is if the expected earnings growth, or the lack of it, is already built into the share price. This then helps them determine if the stock is placed for a bright or bleak future. Is EBO fairly valued? This infographic on the company's intrinsic value has everything you need to know.
Is EBOS Group Making Efficient Use Of Its Profits?
EBOS Group has a significant three-year median payout ratio of 74%, meaning that it is left with only 26% to reinvest into its business. This implies that the company has been able to achieve decent earnings growth despite returning most of its profits to shareholders.
Moreover, EBOS Group is determined to keep sharing its profits with shareholders which we infer from its long history of paying a dividend for at least ten years. Based on the latest analysts' estimates, we found that the company's future payout ratio over the next three years is expected to hold steady at 73%. Accordingly, forecasts suggest that EBOS Group's future ROE will be 12% which is again, similar to the current ROE.
Conclusion
In total, we are pretty happy with EBOS Group's performance. We are particularly impressed by the considerable earnings growth posted by the company, which was likely backed by its high ROE. While the company is paying out most of its earnings as dividends, it has been able to grow its earnings in spite of it, so that's probably a good sign. With that said, the latest industry analyst forecasts reveal that the company's earnings growth is expected to slow down. To know more about the latest analysts predictions for the company, check out this visualization of analyst forecasts for the company.
Valuation is complex, but we're here to simplify it.
Discover if EBOS Group might be undervalued or overvalued with our detailed analysis, featuring fair value estimates, potential risks, dividends, insider trades, and its financial condition.
Access Free AnalysisHave feedback on this article? Concerned about the content? Get in touch with us directly. Alternatively, email editorial-team (at) simplywallst.com.
This article by Simply Wall St is general in nature. We provide commentary based on historical data and analyst forecasts only using an unbiased methodology and our articles are not intended to be financial advice. It does not constitute a recommendation to buy or sell any stock, and does not take account of your objectives, or your financial situation. We aim to bring you long-term focused analysis driven by fundamental data. Note that our analysis may not factor in the latest price-sensitive company announcements or qualitative material. Simply Wall St has no position in any stocks mentioned.
About NZSE:EBO
EBOS Group
Engages in the marketing, wholesale, and distribution of healthcare, medical, pharmaceutical, and animal care products in Australia, Southeast Asia, and New Zealand.
Established dividend payer with adequate balance sheet.
Market Insights


Advertisement
Community Narratives
For the Emperor: Why Games Workshop Could Be a Star Investment
Fair Value UK£160.00|0.4% undervalued
RO
Community Contributor
Securitas will boost margins with AI and tech-driven services
Fair Value SEK 260.91|45.0% undervalued
UN
Community Contributor
A Leader in EV Charging with Growth Potential
Fair Value €27.00|20.4% undervalued
TI
Community Contributor