
Advertisement
- New Zealand
- /
- Healthcare Services
- /
- NZSE:EBO
Is EBOS Group Limited's (NZSE:EBO) Latest Stock Performance Being Led By Its Strong Fundamentals?

Most readers would already know that EBOS Group's (NZSE:EBO) stock increased by 3.0% over the past three months. Since the market usually pay for a company’s long-term financial health, we decided to study the company’s fundamentals to see if they could be influencing the market. Particularly, we will be paying attention to EBOS Group's ROE today.
Return on equity or ROE is an important factor to be considered by a shareholder because it tells them how effectively their capital is being reinvested. In other words, it is a profitability ratio which measures the rate of return on the capital provided by the company's shareholders.
Check out our latest analysis for EBOS Group
How Is ROE Calculated?
The formula for ROE is:
Return on Equity = Net Profit (from continuing operations) ÷ Shareholders' Equity
So, based on the above formula, the ROE for EBOS Group is:
10% = AU$238m ÷ AU$2.3b (Based on the trailing twelve months to December 2022).
The 'return' is the income the business earned over the last year. That means that for every NZ$1 worth of shareholders' equity, the company generated NZ$0.10 in profit.
Why Is ROE Important For Earnings Growth?
So far, we've learned that ROE is a measure of a company's profitability. Depending on how much of these profits the company reinvests or "retains", and how effectively it does so, we are then able to assess a company’s earnings growth potential. Assuming everything else remains unchanged, the higher the ROE and profit retention, the higher the growth rate of a company compared to companies that don't necessarily bear these characteristics.
EBOS Group's Earnings Growth And 10% ROE
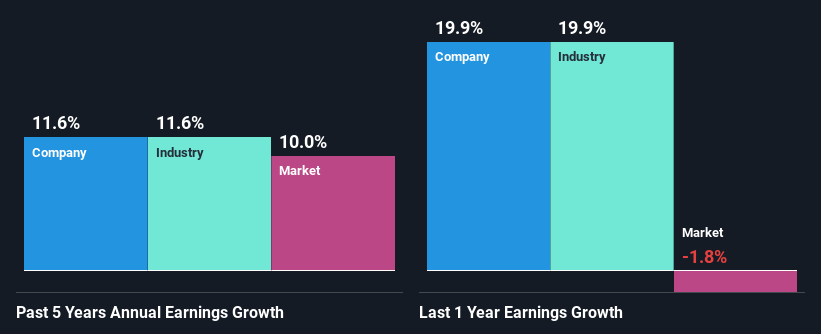
To start with, EBOS Group's ROE looks acceptable. And on comparing with the industry, we found that the the average industry ROE is similar at 12%. This certainly adds some context to EBOS Group's moderate 12% net income growth seen over the past five years.
As a next step, we compared EBOS Group's net income growth with the industry and found that the company has a similar growth figure when compared with the industry average growth rate of 12% in the same period.
Earnings growth is a huge factor in stock valuation. The investor should try to establish if the expected growth or decline in earnings, whichever the case may be, is priced in. This then helps them determine if the stock is placed for a bright or bleak future. Is EBO fairly valued? This infographic on the company's intrinsic value has everything you need to know.
Is EBOS Group Efficiently Re-investing Its Profits?
EBOS Group has a significant three-year median payout ratio of 74%, meaning that it is left with only 26% to reinvest into its business. This implies that the company has been able to achieve decent earnings growth despite returning most of its profits to shareholders.
Additionally, EBOS Group has paid dividends over a period of at least ten years which means that the company is pretty serious about sharing its profits with shareholders. Based on the latest analysts' estimates, we found that the company's future payout ratio over the next three years is expected to hold steady at 70%. However, EBOS Group's ROE is predicted to rise to 13% despite there being no anticipated change in its payout ratio.
Summary
On the whole, we feel that EBOS Group's performance has been quite good. In particular, its high ROE is quite noteworthy and also the probable explanation behind its considerable earnings growth. Yet, the company is retaining a small portion of its profits. Which means that the company has been able to grow its earnings in spite of it, so that's not too bad. The latest industry analyst forecasts show that the company is expected to maintain its current growth rate. To know more about the latest analysts predictions for the company, check out this visualization of analyst forecasts for the company.
Valuation is complex, but we're here to simplify it.
Discover if EBOS Group might be undervalued or overvalued with our detailed analysis, featuring fair value estimates, potential risks, dividends, insider trades, and its financial condition.
Access Free AnalysisHave feedback on this article? Concerned about the content? Get in touch with us directly. Alternatively, email editorial-team (at) simplywallst.com.
This article by Simply Wall St is general in nature. We provide commentary based on historical data and analyst forecasts only using an unbiased methodology and our articles are not intended to be financial advice. It does not constitute a recommendation to buy or sell any stock, and does not take account of your objectives, or your financial situation. We aim to bring you long-term focused analysis driven by fundamental data. Note that our analysis may not factor in the latest price-sensitive company announcements or qualitative material. Simply Wall St has no position in any stocks mentioned.
About NZSE:EBO
EBOS Group
Engages in the marketing, wholesale, and distribution of healthcare, medical, pharmaceutical, and animal care products in Australia, Southeast Asia, and New Zealand.
Adequate balance sheet average dividend payer.
Market Insights

Advertisement
Community Narratives
Groundbreaking therapies that could change the treatment landscape for PTSD, fibromyalgia, MS & Alzheimer’s
Fair Value US$6.20|82.7% undervalued
CM
Community Contributor
DigitalOcean Will Grow 14% by Embracing AI with Paperspace Acquisition
Fair Value US$50.00|36.8% undervalued
NE
Community Contributor
Viant Technology: A Rising AdTech Challenger in the AI-Powered CTV Market
Fair Value US$38.61|61.4% undervalued
BL
Community Contributor
Volvo will Accelerate Forward into Electric and Autonomous Leadership in Five Years
Fair Value SEK 438.80|37.1% undervalued
UN
Community Contributor