- New Zealand
- /
- Food
- /
- NZSE:SEK
Seeka (NZSE:SEK) shareholders are up 11% this past week, but still in the red over the last three years

Many investors define successful investing as beating the market average over the long term. But in any portfolio, there are likely to be some stocks that fall short of that benchmark. Unfortunately, that's been the case for longer term Seeka Limited (NZSE:SEK) shareholders, since the share price is down 50% in the last three years, falling well short of the market decline of around 1.5%.
While the last three years has been tough for Seeka shareholders, this past week has shown signs of promise. So let's look at the longer term fundamentals and see if they've been the driver of the negative returns.
View our latest analysis for Seeka
While the efficient markets hypothesis continues to be taught by some, it has been proven that markets are over-reactive dynamic systems, and investors are not always rational. By comparing earnings per share (EPS) and share price changes over time, we can get a feel for how investor attitudes to a company have morphed over time.
Over the three years that the share price declined, Seeka's earnings per share (EPS) dropped significantly, falling to a loss. Since the company has fallen to a loss making position, it's hard to compare the change in EPS with the share price change. However, we can say we'd expect to see a falling share price in this scenario.
The graphic below depicts how EPS has changed over time (unveil the exact values by clicking on the image).
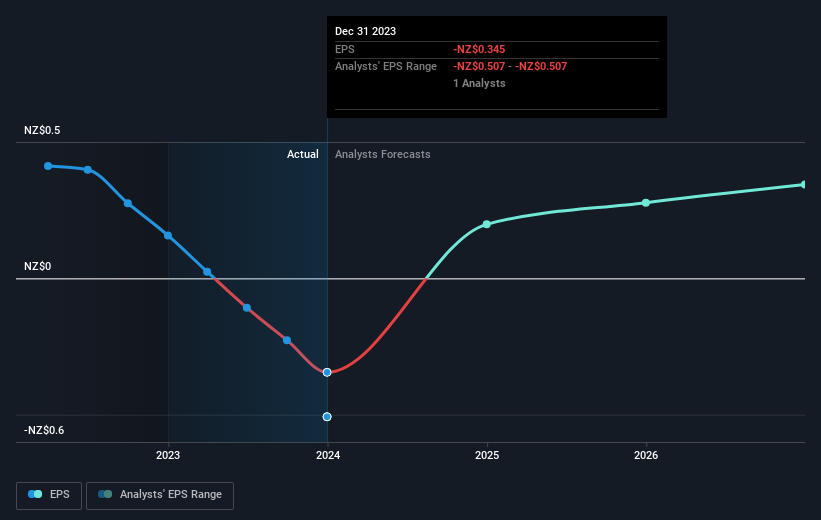
Dive deeper into Seeka's key metrics by checking this interactive graph of Seeka's earnings, revenue and cash flow.
What About The Total Shareholder Return (TSR)?
Investors should note that there's a difference between Seeka's total shareholder return (TSR) and its share price change, which we've covered above. The TSR attempts to capture the value of dividends (as if they were reinvested) as well as any spin-offs or discounted capital raisings offered to shareholders. Seeka's TSR of was a loss of 47% for the 3 years. That wasn't as bad as its share price return, because it has paid dividends.
A Different Perspective
We're pleased to report that Seeka shareholders have received a total shareholder return of 8.3% over one year. Notably the five-year annualised TSR loss of 7% per year compares very unfavourably with the recent share price performance. The long term loss makes us cautious, but the short term TSR gain certainly hints at a brighter future. It's always interesting to track share price performance over the longer term. But to understand Seeka better, we need to consider many other factors. For instance, we've identified 3 warning signs for Seeka (1 makes us a bit uncomfortable) that you should be aware of.
Of course Seeka may not be the best stock to buy. So you may wish to see this free collection of growth stocks.
Please note, the market returns quoted in this article reflect the market weighted average returns of stocks that currently trade on New Zealander exchanges.
New: Manage All Your Stock Portfolios in One Place
We've created the ultimate portfolio companion for stock investors, and it's free.
• Connect an unlimited number of Portfolios and see your total in one currency
• Be alerted to new Warning Signs or Risks via email or mobile
• Track the Fair Value of your stocks
Have feedback on this article? Concerned about the content? Get in touch with us directly. Alternatively, email editorial-team (at) simplywallst.com.
This article by Simply Wall St is general in nature. We provide commentary based on historical data and analyst forecasts only using an unbiased methodology and our articles are not intended to be financial advice. It does not constitute a recommendation to buy or sell any stock, and does not take account of your objectives, or your financial situation. We aim to bring you long-term focused analysis driven by fundamental data. Note that our analysis may not factor in the latest price-sensitive company announcements or qualitative material. Simply Wall St has no position in any stocks mentioned.
About NZSE:SEK
Seeka
Provides orchard lease and management, and post-harvest and retail services to the horticulture industry in New Zealand and Australia.
Good value with mediocre balance sheet.
Market Insights

Community Narratives


