- New Zealand
- /
- Food
- /
- NZSE:NZK
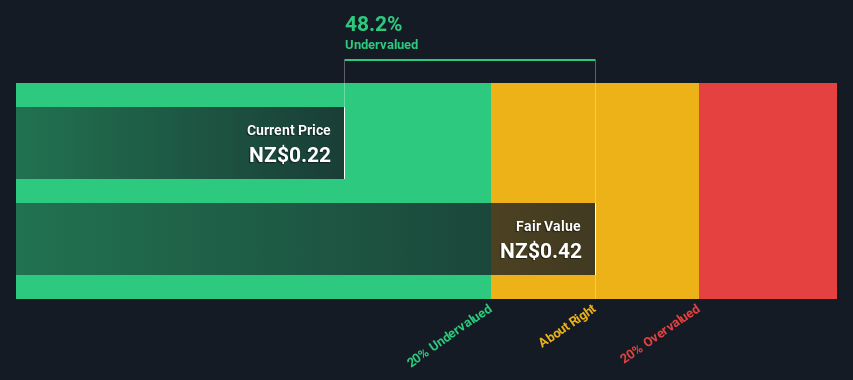
Are Investors Undervaluing New Zealand King Salmon Investments Limited (NZSE:NZK) By 48%?


Key Insights
- New Zealand King Salmon Investments' estimated fair value is NZ$0.42 based on 2 Stage Free Cash Flow to Equity
- New Zealand King Salmon Investments' NZ$0.22 share price signals that it might be 48% undervalued
- New Zealand King Salmon Investments' peers seem to be trading at a higher discount to fair value based onthe industry average of 56%
Today we will run through one way of estimating the intrinsic value of New Zealand King Salmon Investments Limited (NZSE:NZK) by taking the expected future cash flows and discounting them to today's value. The Discounted Cash Flow (DCF) model is the tool we will apply to do this. Before you think you won't be able to understand it, just read on! It's actually much less complex than you'd imagine.
We would caution that there are many ways of valuing a company and, like the DCF, each technique has advantages and disadvantages in certain scenarios. If you still have some burning questions about this type of valuation, take a look at the Simply Wall St analysis model.
View our latest analysis for New Zealand King Salmon Investments
Is New Zealand King Salmon Investments Fairly Valued?
We are going to use a two-stage DCF model, which, as the name states, takes into account two stages of growth. The first stage is generally a higher growth period which levels off heading towards the terminal value, captured in the second 'steady growth' period. In the first stage we need to estimate the cash flows to the business over the next ten years. Seeing as no analyst estimates of free cash flow are available to us, we have extrapolate the previous free cash flow (FCF) from the company's last reported value. We assume companies with shrinking free cash flow will slow their rate of shrinkage, and that companies with growing free cash flow will see their growth rate slow, over this period. We do this to reflect that growth tends to slow more in the early years than it does in later years.
Generally we assume that a dollar today is more valuable than a dollar in the future, so we need to discount the sum of these future cash flows to arrive at a present value estimate:
10-year free cash flow (FCF) forecast
| 2024 | 2025 | 2026 | 2027 | 2028 | 2029 | 2030 | 2031 | 2032 | 2033 | |
| Levered FCF (NZ$, Millions) | NZ$2.13m | NZ$3.42m | NZ$4.91m | NZ$6.43m | NZ$7.87m | NZ$9.16m | NZ$10.3m | NZ$11.2m | NZ$12.0m | NZ$12.7m |
| Growth Rate Estimate Source | Est @ 85.95% | Est @ 60.86% | Est @ 43.29% | Est @ 31.00% | Est @ 22.39% | Est @ 16.37% | Est @ 12.15% | Est @ 9.20% | Est @ 7.13% | Est @ 5.69% |
| Present Value (NZ$, Millions) Discounted @ 6.3% | NZ$2.0 | NZ$3.0 | NZ$4.1 | NZ$5.0 | NZ$5.8 | NZ$6.3 | NZ$6.7 | NZ$6.9 | NZ$6.9 | NZ$6.9 |
("Est" = FCF growth rate estimated by Simply Wall St)
Present Value of 10-year Cash Flow (PVCF) = NZ$54m
We now need to calculate the Terminal Value, which accounts for all the future cash flows after this ten year period. The Gordon Growth formula is used to calculate Terminal Value at a future annual growth rate equal to the 5-year average of the 10-year government bond yield of 2.3%. We discount the terminal cash flows to today's value at a cost of equity of 6.3%.
Terminal Value (TV)= FCF2033 × (1 + g) ÷ (r – g) = NZ$13m× (1 + 2.3%) ÷ (6.3%– 2.3%) = NZ$325m
Present Value of Terminal Value (PVTV)= TV / (1 + r)10= NZ$325m÷ ( 1 + 6.3%)10= NZ$176m
The total value, or equity value, is then the sum of the present value of the future cash flows, which in this case is NZ$230m. The last step is to then divide the equity value by the number of shares outstanding. Compared to the current share price of NZ$0.2, the company appears quite good value at a 48% discount to where the stock price trades currently. Valuations are imprecise instruments though, rather like a telescope - move a few degrees and end up in a different galaxy. Do keep this in mind.
Important Assumptions
We would point out that the most important inputs to a discounted cash flow are the discount rate and of course the actual cash flows. Part of investing is coming up with your own evaluation of a company's future performance, so try the calculation yourself and check your own assumptions. The DCF also does not consider the possible cyclicality of an industry, or a company's future capital requirements, so it does not give a full picture of a company's potential performance. Given that we are looking at New Zealand King Salmon Investments as potential shareholders, the cost of equity is used as the discount rate, rather than the cost of capital (or weighted average cost of capital, WACC) which accounts for debt. In this calculation we've used 6.3%, which is based on a levered beta of 0.800. Beta is a measure of a stock's volatility, compared to the market as a whole. We get our beta from the industry average beta of globally comparable companies, with an imposed limit between 0.8 and 2.0, which is a reasonable range for a stable business.
Next Steps:
Valuation is only one side of the coin in terms of building your investment thesis, and it shouldn't be the only metric you look at when researching a company. It's not possible to obtain a foolproof valuation with a DCF model. Rather it should be seen as a guide to "what assumptions need to be true for this stock to be under/overvalued?" For example, changes in the company's cost of equity or the risk free rate can significantly impact the valuation. Why is the intrinsic value higher than the current share price? For New Zealand King Salmon Investments, we've put together three relevant items you should further examine:
- Risks: Take risks, for example - New Zealand King Salmon Investments has 2 warning signs we think you should be aware of.
- Future Earnings: How does NZK's growth rate compare to its peers and the wider market? Dig deeper into the analyst consensus number for the upcoming years by interacting with our free analyst growth expectation chart.
- Other Solid Businesses: Low debt, high returns on equity and good past performance are fundamental to a strong business. Why not explore our interactive list of stocks with solid business fundamentals to see if there are other companies you may not have considered!
PS. The Simply Wall St app conducts a discounted cash flow valuation for every stock on the NZSE every day. If you want to find the calculation for other stocks just search here.
Valuation is complex, but we're here to simplify it.
Discover if New Zealand King Salmon Investments might be undervalued or overvalued with our detailed analysis, featuring fair value estimates, potential risks, dividends, insider trades, and its financial condition.
Access Free AnalysisHave feedback on this article? Concerned about the content? Get in touch with us directly. Alternatively, email editorial-team (at) simplywallst.com.
This article by Simply Wall St is general in nature. We provide commentary based on historical data and analyst forecasts only using an unbiased methodology and our articles are not intended to be financial advice. It does not constitute a recommendation to buy or sell any stock, and does not take account of your objectives, or your financial situation. We aim to bring you long-term focused analysis driven by fundamental data. Note that our analysis may not factor in the latest price-sensitive company announcements or qualitative material. Simply Wall St has no position in any stocks mentioned.
About NZSE:NZK
New Zealand King Salmon Investments
Engages in the farming, processing, and sale of salmon products in New Zealand, North America, Australia, Japan, Europe, China, and internationally.
Flawless balance sheet and good value.
Similar Companies
Market Insights

Community Narratives

