
Advertisement
- New Zealand
- /
- Hospitality
- /
- NZSE:SKC
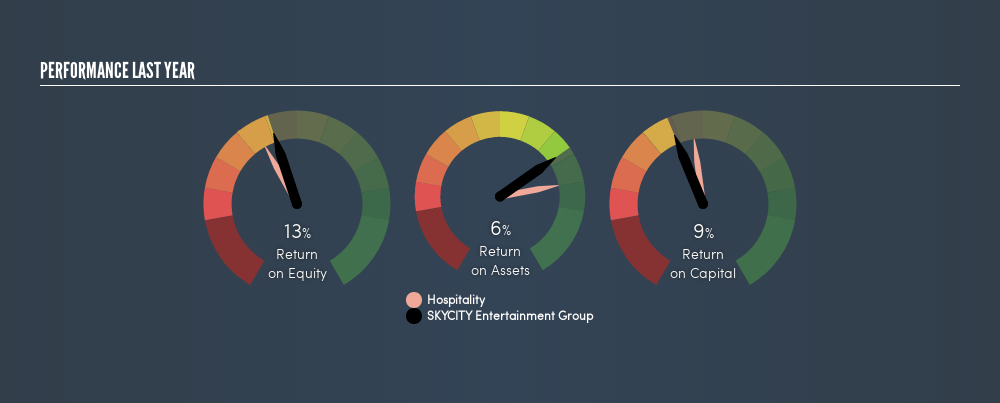
Is There More To SKYCITY Entertainment Group Limited (NZSE:SKC) Than Its 9.3% Returns On Capital?

Today we'll look at SKYCITY Entertainment Group Limited (NZSE:SKC) and reflect on its potential as an investment. Specifically, we're going to calculate its Return On Capital Employed (ROCE), in the hopes of getting some insight into the business.
First up, we'll look at what ROCE is and how we calculate it. Second, we'll look at its ROCE compared to similar companies. And finally, we'll look at how its current liabilities are impacting its ROCE.
Return On Capital Employed (ROCE): What is it?
ROCE measures the amount of pre-tax profits a company can generate from the capital employed in its business. All else being equal, a better business will have a higher ROCE. Overall, it is a valuable metric that has its flaws. Author Edwin Whiting says to be careful when comparing the ROCE of different businesses, since 'No two businesses are exactly alike.'
How Do You Calculate Return On Capital Employed?
Analysts use this formula to calculate return on capital employed:
Return on Capital Employed = Earnings Before Interest and Tax (EBIT) ÷ (Total Assets - Current Liabilities)
Or for SKYCITY Entertainment Group:
0.093 = NZ$231m ÷ (NZ$2.7b - NZ$195m) (Based on the trailing twelve months to December 2018.)
Therefore, SKYCITY Entertainment Group has an ROCE of 9.3%.
See our latest analysis for SKYCITY Entertainment Group
Is SKYCITY Entertainment Group's ROCE Good?
When making comparisons between similar businesses, investors may find ROCE useful. It appears that SKYCITY Entertainment Group's ROCE is fairly close to the Hospitality industry average of 9.5%. Separate from how SKYCITY Entertainment Group stacks up against its industry, its ROCE in absolute terms is mediocre; relative to the returns on government bonds. Readers may find more attractive investment prospects elsewhere.
Remember that this metric is backwards looking - it shows what has happened in the past, and does not accurately predict the future. Companies in cyclical industries can be difficult to understand using ROCE, as returns typically look high during boom times, and low during busts. ROCE is only a point-in-time measure. Future performance is what matters, and you can see analyst predictions in our freereport on analyst forecasts for the company.
Do SKYCITY Entertainment Group's Current Liabilities Skew Its ROCE?
Current liabilities include invoices, such as supplier payments, short-term debt, or a tax bill, that need to be paid within 12 months. The ROCE equation subtracts current liabilities from capital employed, so a company with a lot of current liabilities appears to have less capital employed, and a higher ROCE than otherwise. To counteract this, we check if a company has high current liabilities, relative to its total assets.
SKYCITY Entertainment Group has total liabilities of NZ$195m and total assets of NZ$2.7b. As a result, its current liabilities are equal to approximately 7.3% of its total assets. SKYCITY Entertainment Group has a low level of current liabilities, which have a minimal impact on its uninspiring ROCE.
Our Take On SKYCITY Entertainment Group's ROCE
SKYCITY Entertainment Group looks like an ok business, but on this analysis it is not at the top of our buy list. Of course, you might find a fantastic investment by looking at a few good candidates. So take a peek at this freelist of companies with modest (or no) debt, trading on a P/E below 20.
For those who like to find winning investments this freelist of growing companies with recent insider purchasing, could be just the ticket.
We aim to bring you long-term focused research analysis driven by fundamental data. Note that our analysis may not factor in the latest price-sensitive company announcements or qualitative material.
If you spot an error that warrants correction, please contact the editor at editorial-team@simplywallst.com. This article by Simply Wall St is general in nature. It does not constitute a recommendation to buy or sell any stock, and does not take account of your objectives, or your financial situation. Simply Wall St has no position in the stocks mentioned. Thank you for reading.
About NZSE:SKC
SkyCity Entertainment Group
Operates in the gaming, entertainment, hotel, convention, hospitality, and tourism sectors in New Zealand and Australia.
Good value with reasonable growth potential.
Market Insights


Advertisement
Community Narratives
The Future of Drug Testing? Fingerprint Tech Shows Serious Promise
Fair Value US$2.98|40.3% undervalued
JO
Community Contributor
Suncorp’s Next Chapter: Insurance-Only and Ready to Grow
Fair Value AU$22.83|7.9% undervalued
RO
Community Contributor
Thyssenkrupp Nucera Will Achieve Double-Digit Profits by 2030 Boosted by Hydrogen Growth
Fair Value €14.40|31.3% undervalued
CH
Community Contributor
Tesla’s Nvidia Moment – The AI & Robotics Inflection Point
Fair Value US$359.72|12.3% undervalued
BL
Community Contributor