
Advertisement
- New Zealand
- /
- Building
- /
- NZSE:FBU
There's Reason For Concern Over Fletcher Building Limited's (NZSE:FBU) Massive 26% Price Jump
Those holding Fletcher Building Limited (NZSE:FBU) shares would be relieved that the share price has rebounded 26% in the last thirty days, but it needs to keep going to repair the recent damage it has caused to investor portfolios. The bad news is that even after the stocks recovery in the last 30 days, shareholders are still underwater by about 3.2% over the last year.
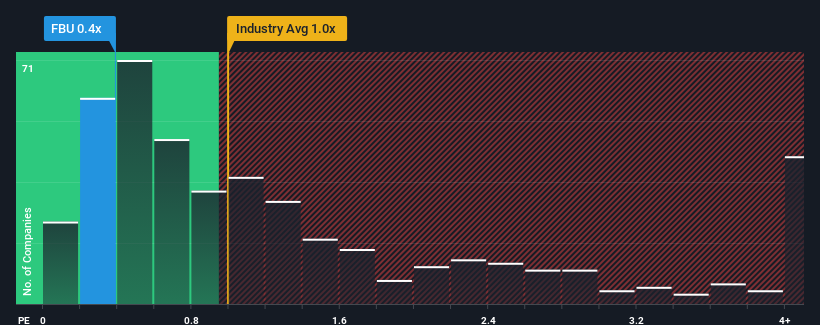
Although its price has surged higher, you could still be forgiven for feeling indifferent about Fletcher Building's P/S ratio of 0.4x, since the median price-to-sales (or "P/S") ratio for the Building industry in New Zealand is about the same. Although, it's not wise to simply ignore the P/S without explanation as investors may be disregarding a distinct opportunity or a costly mistake.
Check out our latest analysis for Fletcher Building
How Fletcher Building Has Been Performing
There hasn't been much to differentiate Fletcher Building's and the industry's retreating revenue lately. It seems that few are expecting the company's revenue performance to deviate much from most other companies, which has held the P/S back. So while you could say the stock is cheap, investors will be looking for improvement before they see it as good value. In saying that, existing shareholders probably aren't too pessimistic about the share price if the company's revenue continues tracking the industry.
If you'd like to see what analysts are forecasting going forward, you should check out our free report on Fletcher Building.What Are Revenue Growth Metrics Telling Us About The P/S?
Fletcher Building's P/S ratio would be typical for a company that's only expected to deliver moderate growth, and importantly, perform in line with the industry.
In reviewing the last year of financials, we were disheartened to see the company's revenues fell to the tune of 3.3%. That put a dampener on the good run it was having over the longer-term as its three-year revenue growth is still a noteworthy 15% in total. Although it's been a bumpy ride, it's still fair to say the revenue growth recently has been mostly respectable for the company.
Shifting to the future, estimates from the twelve analysts covering the company suggest revenue should grow by 1.7% each year over the next three years. That's shaping up to be materially lower than the 5.5% per annum growth forecast for the broader industry.
With this in mind, we find it intriguing that Fletcher Building's P/S is closely matching its industry peers. Apparently many investors in the company are less bearish than analysts indicate and aren't willing to let go of their stock right now. Maintaining these prices will be difficult to achieve as this level of revenue growth is likely to weigh down the shares eventually.
What Does Fletcher Building's P/S Mean For Investors?
Fletcher Building appears to be back in favour with a solid price jump bringing its P/S back in line with other companies in the industry Using the price-to-sales ratio alone to determine if you should sell your stock isn't sensible, however it can be a practical guide to the company's future prospects.
Our look at the analysts forecasts of Fletcher Building's revenue prospects has shown that its inferior revenue outlook isn't negatively impacting its P/S as much as we would have predicted. At present, we aren't confident in the P/S as the predicted future revenues aren't likely to support a more positive sentiment for long. This places shareholders' investments at risk and potential investors in danger of paying an unnecessary premium.
There are also other vital risk factors to consider before investing and we've discovered 4 warning signs for Fletcher Building that you should be aware of.
If companies with solid past earnings growth is up your alley, you may wish to see this free collection of other companies with strong earnings growth and low P/E ratios.
New: AI Stock Screener & Alerts
Our new AI Stock Screener scans the market every day to uncover opportunities.
• Dividend Powerhouses (3%+ Yield)
• Undervalued Small Caps with Insider Buying
• High growth Tech and AI Companies
Or build your own from over 50 metrics.
Have feedback on this article? Concerned about the content? Get in touch with us directly. Alternatively, email editorial-team (at) simplywallst.com.
This article by Simply Wall St is general in nature. We provide commentary based on historical data and analyst forecasts only using an unbiased methodology and our articles are not intended to be financial advice. It does not constitute a recommendation to buy or sell any stock, and does not take account of your objectives, or your financial situation. We aim to bring you long-term focused analysis driven by fundamental data. Note that our analysis may not factor in the latest price-sensitive company announcements or qualitative material. Simply Wall St has no position in any stocks mentioned.
About NZSE:FBU
Fletcher Building
Manufactures and distributes building products in New Zealand, Australia, and internationally.
Undervalued with adequate balance sheet.
Similar Companies
Market Insights

Advertisement
Community Narratives
MINISO's fair value is projected at 26.69 with an anticipated PE ratio shift of 20x
Fair Value US$24.03|11.0% undervalued
BE
Community Contributor
Procter & Gamble: A Dividend Giant Facing Slowing Growth
Fair Value US$119.81|23.3% overvalued
AN
Community Contributor
Eli Lilly's Future Growth Driven by Tirzepatide and Favorable Market Conditions
Fair Value US$1.19k|13.8% undervalued
EA
Community Contributor