
Advertisement
- New Zealand
- /
- Building
- /
- NZSE:FBU
Further weakness as Fletcher Building (NZSE:FBU) drops 6.6% this week, taking three-year losses to 33%
Many investors define successful investing as beating the market average over the long term. But the risk of stock picking is that you will likely buy under-performing companies. Unfortunately, that's been the case for longer term Fletcher Building Limited (NZSE:FBU) shareholders, since the share price is down 44% in the last three years, falling well short of the market return of around 14%. On top of that, the share price is down 6.6% in the last week.
With the stock having lost 6.6% in the past week, it's worth taking a look at business performance and seeing if there's any red flags.
While markets are a powerful pricing mechanism, share prices reflect investor sentiment, not just underlying business performance. One flawed but reasonable way to assess how sentiment around a company has changed is to compare the earnings per share (EPS) with the share price.
Fletcher Building has made a profit in the past. On the other hand, it reported a trailing twelve months loss, suggesting it isn't reliably profitable. Other metrics might give us a better handle on how its value is changing over time.
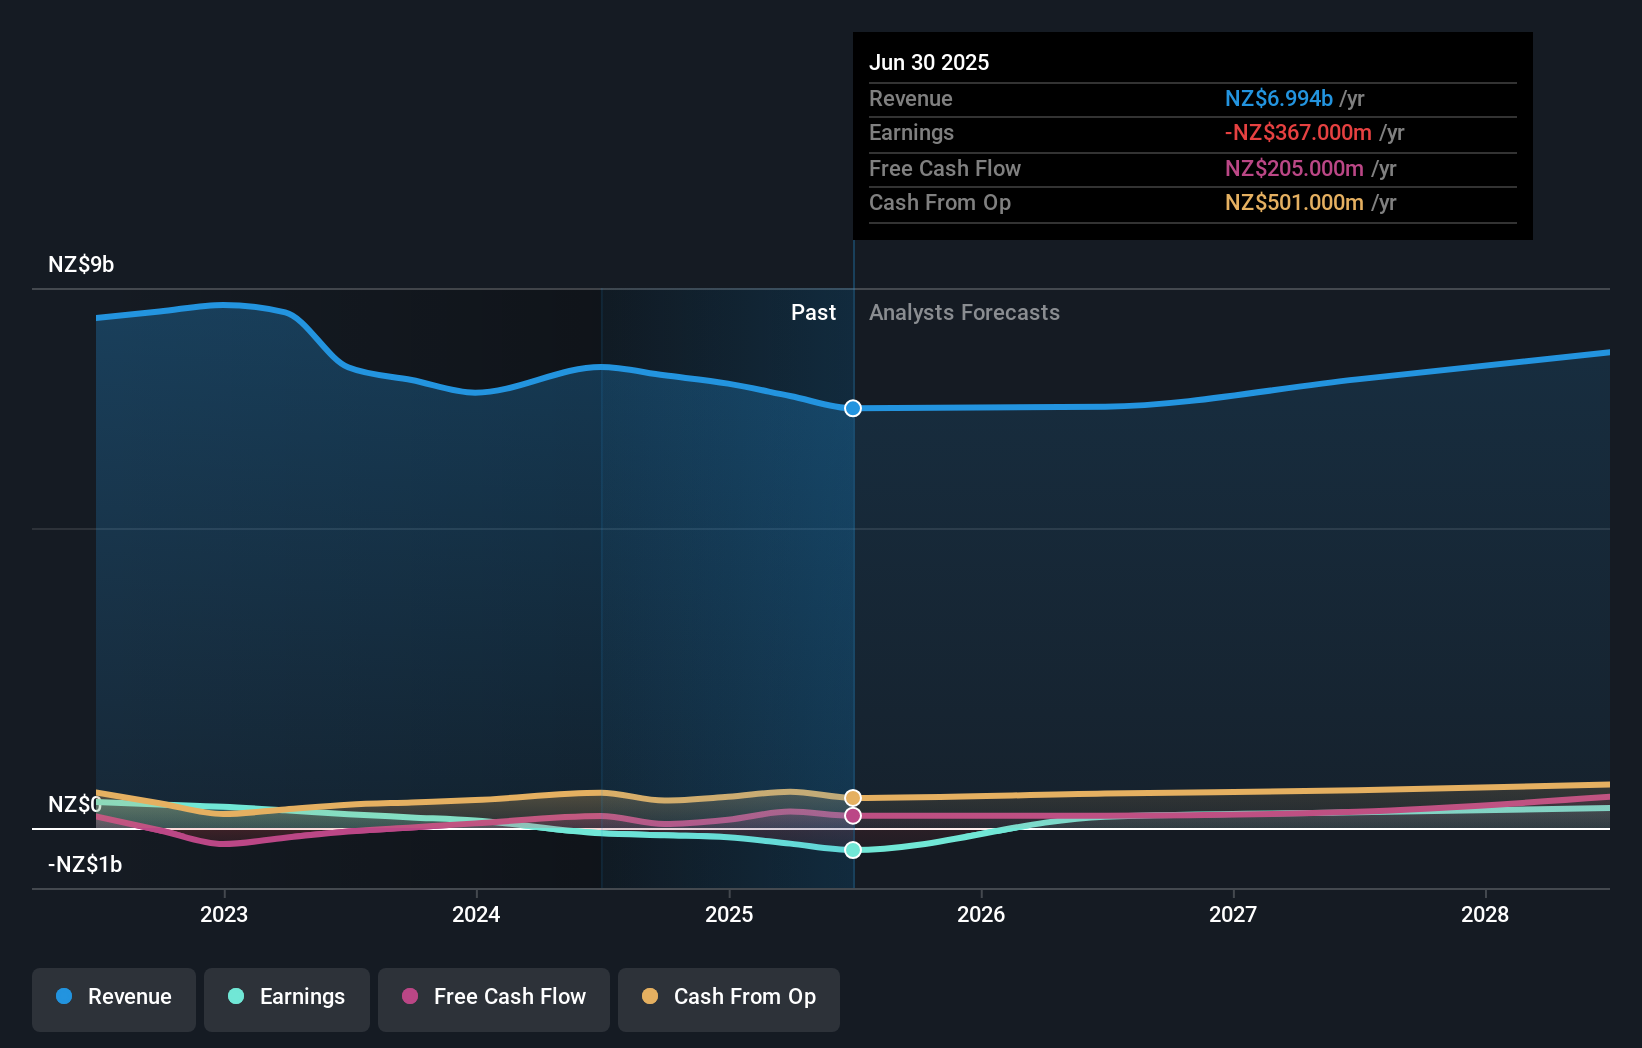
Arguably the revenue decline of 6.8% per year has people thinking Fletcher Building is shrinking. After all, if revenue keeps shrinking, it may be difficult to find earnings growth in the future.
You can see how earnings and revenue have changed over time in the image below (click on the chart to see the exact values).
We consider it positive that insiders have made significant purchases in the last year. Having said that, most people consider earnings and revenue growth trends to be a more meaningful guide to the business. You can see what analysts are predicting for Fletcher Building in this interactive graph of future profit estimates.
What About The Total Shareholder Return (TSR)?
We'd be remiss not to mention the difference between Fletcher Building's total shareholder return (TSR) and its share price return. Arguably the TSR is a more complete return calculation because it accounts for the value of dividends (as if they were reinvested), along with the hypothetical value of any discounted capital that have been offered to shareholders. Fletcher Building's TSR of was a loss of 33% for the 3 years. That wasn't as bad as its share price return, because it has paid dividends.
A Different Perspective
It's nice to see that Fletcher Building shareholders have received a total shareholder return of 16% over the last year. That's better than the annualised return of 1.4% over half a decade, implying that the company is doing better recently. Someone with an optimistic perspective could view the recent improvement in TSR as indicating that the business itself is getting better with time. It's always interesting to track share price performance over the longer term. But to understand Fletcher Building better, we need to consider many other factors. Consider for instance, the ever-present spectre of investment risk. We've identified 1 warning sign with Fletcher Building , and understanding them should be part of your investment process.
Fletcher Building is not the only stock that insiders are buying. For those who like to find lesser know companies this free list of growing companies with recent insider purchasing, could be just the ticket.
Please note, the market returns quoted in this article reflect the market weighted average returns of stocks that currently trade on New Zealander exchanges.
New: AI Stock Screener & Alerts
Our new AI Stock Screener scans the market every day to uncover opportunities.
• Dividend Powerhouses (3%+ Yield)
• Undervalued Small Caps with Insider Buying
• High growth Tech and AI Companies
Or build your own from over 50 metrics.
Have feedback on this article? Concerned about the content? Get in touch with us directly. Alternatively, email editorial-team (at) simplywallst.com.
This article by Simply Wall St is general in nature. We provide commentary based on historical data and analyst forecasts only using an unbiased methodology and our articles are not intended to be financial advice. It does not constitute a recommendation to buy or sell any stock, and does not take account of your objectives, or your financial situation. We aim to bring you long-term focused analysis driven by fundamental data. Note that our analysis may not factor in the latest price-sensitive company announcements or qualitative material. Simply Wall St has no position in any stocks mentioned.
About NZSE:FBU
Fletcher Building
Manufactures and distributes building products in New Zealand, Australia, and internationally.
Undervalued with adequate balance sheet.
Similar Companies
Market Insights

Advertisement
Community Narratives
The company that turned a verb into a global necessity and basically runs the modern internet, digital ads, smartphones, maps, and AI.
Fair Value US$300.00|6.2% undervalued
OS
Community Contributor
Flowers Foods Pays A Fair Price For Health
Fair Value US$16.12|26.0% undervalued
NV
Community Contributor
TMX Group will thrive with 33.3% profit margin and enduring market moat
Fair Value CA$49.90|3.7% overvalued
LI
Community Contributor