
Advertisement
- Norway
- /
- Marine and Shipping
- /
- OB:KCC
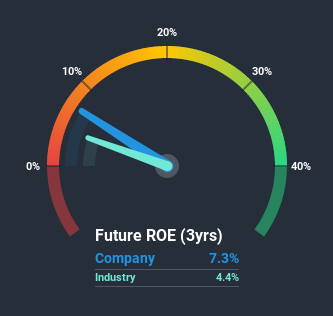
Is Klaveness Combination Carriers ASA's (OB:KCC) 7.3% ROE Better Than Average?
One of the best investments we can make is in our own knowledge and skill set. With that in mind, this article will work through how we can use Return On Equity (ROE) to better understand a business. To keep the lesson grounded in practicality, we'll use ROE to better understand Klaveness Combination Carriers ASA (OB:KCC).
Return on equity or ROE is a key measure used to assess how efficiently a company's management is utilizing the company's capital. Simply put, it is used to assess the profitability of a company in relation to its equity capital.
Check out our latest analysis for Klaveness Combination Carriers
How Is ROE Calculated?
The formula for ROE is:
Return on Equity = Net Profit (from continuing operations) ÷ Shareholders' Equity
So, based on the above formula, the ROE for Klaveness Combination Carriers is:
7.3% = US$16m ÷ US$216m (Based on the trailing twelve months to September 2020).
The 'return' is the yearly profit. That means that for every NOK1 worth of shareholders' equity, the company generated NOK0.07 in profit.
Does Klaveness Combination Carriers Have A Good Return On Equity?
Arguably the easiest way to assess company's ROE is to compare it with the average in its industry. However, this method is only useful as a rough check, because companies do differ quite a bit within the same industry classification. As is clear from the image below, Klaveness Combination Carriers has a better ROE than the average (4.4%) in the Shipping industry.
That's clearly a positive. With that said, a high ROE doesn't always indicate high profitability. A higher proportion of debt in a company's capital structure may also result in a high ROE, where the high debt levels could be a huge risk . To know the 2 risks we have identified for Klaveness Combination Carriers visit our risks dashboard for free.
How Does Debt Impact ROE?
Virtually all companies need money to invest in the business, to grow profits. That cash can come from retained earnings, issuing new shares (equity), or debt. In the case of the first and second options, the ROE will reflect this use of cash, for growth. In the latter case, the debt used for growth will improve returns, but won't affect the total equity. That will make the ROE look better than if no debt was used.
Combining Klaveness Combination Carriers' Debt And Its 7.3% Return On Equity
It's worth noting the high use of debt by Klaveness Combination Carriers, leading to its debt to equity ratio of 1.27. Its ROE is quite low, even with the use of significant debt; that's not a good result, in our opinion. Debt increases risk and reduces options for the company in the future, so you generally want to see some good returns from using it.
Summary
Return on equity is a useful indicator of the ability of a business to generate profits and return them to shareholders. A company that can achieve a high return on equity without debt could be considered a high quality business. All else being equal, a higher ROE is better.
But ROE is just one piece of a bigger puzzle, since high quality businesses often trade on high multiples of earnings. The rate at which profits are likely to grow, relative to the expectations of profit growth reflected in the current price, must be considered, too. So I think it may be worth checking this free this detailed graph of past earnings, revenue and cash flow.
Of course, you might find a fantastic investment by looking elsewhere. So take a peek at this free list of interesting companies.
If you’re looking to trade Klaveness Combination Carriers, open an account with the lowest-cost* platform trusted by professionals, Interactive Brokers. Their clients from over 200 countries and territories trade stocks, options, futures, forex, bonds and funds worldwide from a single integrated account. Promoted
Valuation is complex, but we're here to simplify it.
Discover if Klaveness Combination Carriers might be undervalued or overvalued with our detailed analysis, featuring fair value estimates, potential risks, dividends, insider trades, and its financial condition.
Access Free AnalysisThis article by Simply Wall St is general in nature. It does not constitute a recommendation to buy or sell any stock, and does not take account of your objectives, or your financial situation. We aim to bring you long-term focused analysis driven by fundamental data. Note that our analysis may not factor in the latest price-sensitive company announcements or qualitative material. Simply Wall St has no position in any stocks mentioned.
*Interactive Brokers Rated Lowest Cost Broker by StockBrokers.com Annual Online Review 2020
Have feedback on this article? Concerned about the content? Get in touch with us directly. Alternatively, email editorial-team (at) simplywallst.com.
About OB:KCC
Klaveness Combination Carriers
Owns and operates combination carriers for the dry bulk shipping and product tanker industries in the Middle East, Australia, Oceania, North East Asia, South America, North America, Europe, Africa, Southeast Asia, and South Asia.
Adequate balance sheet and fair value.
Similar Companies
Market Insights

Advertisement
Community Narratives
Kodiak AI - a potential 100 bagger opportunity?
Fair Value US$14.00|44.7% undervalued
DA
Community Contributor
A Fair Price for a Great Business Facing Real Threats
Fair Value US$383.06|13.0% undervalued
IM
Community Contributor
AXON And Shopify Integration Will Unlock Global Mobile Advertising
Fair Value US$646.30|0% overvalued
AN
Based on Analyst Price Targets