
Advertisement
Market Might Still Lack Some Conviction On StrongPoint ASA (OB:STRO) Even After 31% Share Price Boost
StrongPoint ASA (OB:STRO) shareholders are no doubt pleased to see that the share price has bounced 31% in the last month, although it is still struggling to make up recently lost ground. Unfortunately, the gains of the last month did little to right the losses of the last year with the stock still down 26% over that time.
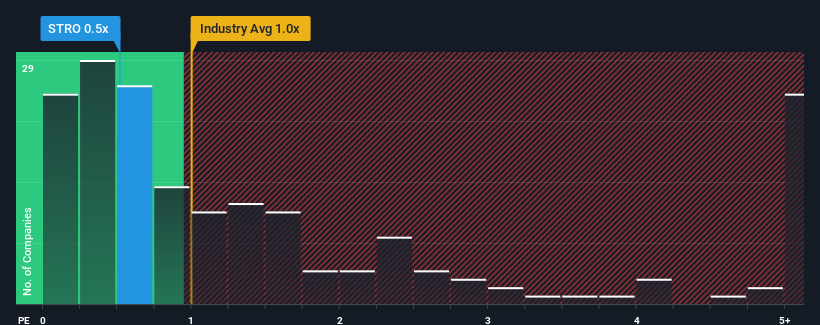
In spite of the firm bounce in price, StrongPoint may still be sending buy signals at present with its price-to-sales (or "P/S") ratio of 0.5x, considering almost half of all companies in the Electronic industry in Norway have P/S ratios greater than 2x and even P/S higher than 13x aren't out of the ordinary. Nonetheless, we'd need to dig a little deeper to determine if there is a rational basis for the reduced P/S.
View our latest analysis for StrongPoint
How StrongPoint Has Been Performing
With revenue growth that's inferior to most other companies of late, StrongPoint has been relatively sluggish. Perhaps the market is expecting the current trend of poor revenue growth to continue, which has kept the P/S suppressed. If this is the case, then existing shareholders will probably struggle to get excited about the future direction of the share price.
Keen to find out how analysts think StrongPoint's future stacks up against the industry? In that case, our free report is a great place to start.Is There Any Revenue Growth Forecasted For StrongPoint?
The only time you'd be truly comfortable seeing a P/S as low as StrongPoint's is when the company's growth is on track to lag the industry.
If we review the last year of revenue growth, the company posted a worthy increase of 13%. Pleasingly, revenue has also lifted 71% in aggregate from three years ago, partly thanks to the last 12 months of growth. So we can start by confirming that the company has done a great job of growing revenues over that time.
Looking ahead now, revenue is anticipated to climb by 15% per annum during the coming three years according to the two analysts following the company. Meanwhile, the rest of the industry is forecast to only expand by 10.0% per year, which is noticeably less attractive.
With this information, we find it odd that StrongPoint is trading at a P/S lower than the industry. It looks like most investors are not convinced at all that the company can achieve future growth expectations.
What We Can Learn From StrongPoint's P/S?
StrongPoint's stock price has surged recently, but its but its P/S still remains modest. Using the price-to-sales ratio alone to determine if you should sell your stock isn't sensible, however it can be a practical guide to the company's future prospects.
StrongPoint's analyst forecasts revealed that its superior revenue outlook isn't contributing to its P/S anywhere near as much as we would have predicted. The reason for this depressed P/S could potentially be found in the risks the market is pricing in. At least price risks look to be very low, but investors seem to think future revenues could see a lot of volatility.
It's always necessary to consider the ever-present spectre of investment risk. We've identified 3 warning signs with StrongPoint (at least 1 which is potentially serious), and understanding these should be part of your investment process.
If strong companies turning a profit tickle your fancy, then you'll want to check out this free list of interesting companies that trade on a low P/E (but have proven they can grow earnings).
New: Manage All Your Stock Portfolios in One Place
We've created the ultimate portfolio companion for stock investors, and it's free.
• Connect an unlimited number of Portfolios and see your total in one currency
• Be alerted to new Warning Signs or Risks via email or mobile
• Track the Fair Value of your stocks
Have feedback on this article? Concerned about the content? Get in touch with us directly. Alternatively, email editorial-team (at) simplywallst.com.
This article by Simply Wall St is general in nature. We provide commentary based on historical data and analyst forecasts only using an unbiased methodology and our articles are not intended to be financial advice. It does not constitute a recommendation to buy or sell any stock, and does not take account of your objectives, or your financial situation. We aim to bring you long-term focused analysis driven by fundamental data. Note that our analysis may not factor in the latest price-sensitive company announcements or qualitative material. Simply Wall St has no position in any stocks mentioned.
About OB:STRO
StrongPoint
Engages in the development, sale, and implementation of integrated technology solutions to retailers in Scandinavia and internationally.
Reasonable growth potential with adequate balance sheet.
Market Insights

Advertisement
Community Narratives
MicroVision will explode future revenue by 380.37% with a vision towards success
Fair Value US$60|98.4% undervalued
TH
Community Contributor
The Indispensable Artery for a New North American Economy
Fair Value CA$132.87|0.8% undervalued
TI
Community Contributor
Recently Updated Narratives
CO

composite32 on TAV Havalimanlari Holding ·
TAV Havalimanlari Holding will fly high with 25.68% revenue growth
Fair Value:₺545.1648.6% undervalued
3 followersusers have followed this narrative
0 commentsusers have commented on this narrative
0 likesusers have liked this narrative
RO


Robbo on Fiducian Group ·
Fiducian: Compliance Clouds or Value Opportunity?
Fair Value:AU$120.8% undervalued
1 followerusers have followed this narrative
0 commentsusers have commented on this narrative
0 likesusers have liked this narrative
MA


MarkoVT on COVER ·
Q3 Outlook modestly optimistic
Fair Value:JP¥1.65k1.3% overvalued
1 followerusers have followed this narrative
0 commentsusers have commented on this narrative
0 likesusers have liked this narrative
Popular Narratives
TH

TheWallstreetKing on MicroVision ·
MicroVision will explode future revenue by 380.37% with a vision towards success
Fair Value:US$6098.4% undervalued
93 followersusers have followed this narrative
10 commentsusers have commented on this narrative
18 likesusers have liked this narrative
OS


oscargarcia on Alphabet ·
The company that turned a verb into a global necessity and basically runs the modern internet, digital ads, smartphones, maps, and AI.
Fair Value:US$3405.9% undervalued
136 followersusers have followed this narrative
6 commentsusers have commented on this narrative
18 likesusers have liked this narrative
AN


AnalystConsensusTarget on NVIDIA ·
NVDA: Expanding AI Demand Will Drive Major Data Center Investments Through 2026
Fair Value:US$232.7922.6% undervalued
929 followersusers have followed this narrative
6 commentsusers have commented on this narrative
22 likesusers have liked this narrative