
Advertisement
Even when a business is losing money, it's possible for shareholders to make money if they buy a good business at the right price. For example, although software-as-a-service business Salesforce.com lost money for years while it grew recurring revenue, if you held shares since 2005, you'd have done very well indeed. But the harsh reality is that very many loss making companies burn through all their cash and go bankrupt.
So, the natural question for Huddly (OB:HDLY) shareholders is whether they should be concerned by its rate of cash burn. For the purpose of this article, we'll define cash burn as the amount of cash the company is spending each year to fund its growth (also called its negative free cash flow). Let's start with an examination of the business' cash, relative to its cash burn.
View our latest analysis for Huddly
SWOT Analysis for Huddly
Strength
- Currently debt free.
Weakness
- No major weaknesses identified for HDLY.
Opportunity
- Expected to breakeven next year.
- Good value based on P/S ratio compared to estimated Fair P/S ratio.
Threat
- Has less than 3 years of cash runway based on current free cash flow.
When Might Huddly Run Out Of Money?
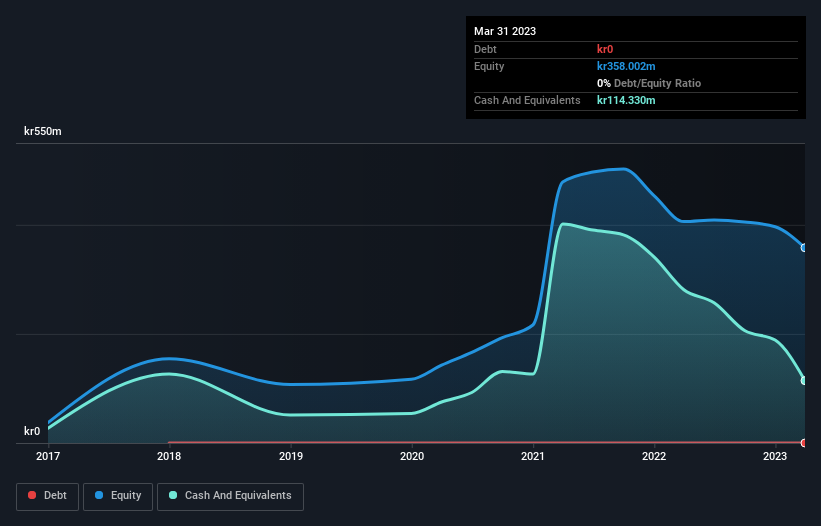
A cash runway is defined as the length of time it would take a company to run out of money if it kept spending at its current rate of cash burn. As at March 2023, Huddly had cash of kr114m and no debt. In the last year, its cash burn was kr147m. So it had a cash runway of approximately 9 months from March 2023. That's quite a short cash runway, indicating the company must either reduce its annual cash burn or replenish its cash. The image below shows how its cash balance has been changing over the last few years.
How Well Is Huddly Growing?
Notably, Huddly actually ramped up its cash burn very hard and fast in the last year, by 129%, signifying heavy investment in the business. That does give us pause, and we can't take much solace in the operating revenue growth of 6.0% in the same time frame. Taken together, we think these growth metrics are a little worrying. While the past is always worth studying, it is the future that matters most of all. So you might want to take a peek at how much the company is expected to grow in the next few years.
How Hard Would It Be For Huddly To Raise More Cash For Growth?
Given the trajectory of Huddly's cash burn, many investors will already be thinking about how it might raise more cash in the future. Issuing new shares, or taking on debt, are the most common ways for a listed company to raise more money for its business. Many companies end up issuing new shares to fund future growth. By comparing a company's annual cash burn to its total market capitalisation, we can estimate roughly how many shares it would have to issue in order to run the company for another year (at the same burn rate).
Huddly's cash burn of kr147m is about 43% of its kr343m market capitalisation. That's high expenditure relative to the value of the entire company, so if it does have to issue shares to fund more growth, that could end up really hurting shareholders returns (through significant dilution).
How Risky Is Huddly's Cash Burn Situation?
On this analysis of Huddly's cash burn, we think its revenue growth was reassuring, while its increasing cash burn has us a bit worried. Considering all the measures mentioned in this report, we reckon that its cash burn is fairly risky, and if we held shares we'd be watching like a hawk for any deterioration. On another note, Huddly has 3 warning signs (and 2 which shouldn't be ignored) we think you should know about.
Of course, you might find a fantastic investment by looking elsewhere. So take a peek at this free list of companies insiders are buying, and this list of stocks growth stocks (according to analyst forecasts)
Valuation is complex, but we're here to simplify it.
Discover if Huddly might be undervalued or overvalued with our detailed analysis, featuring fair value estimates, potential risks, dividends, insider trades, and its financial condition.
Access Free AnalysisHave feedback on this article? Concerned about the content? Get in touch with us directly. Alternatively, email editorial-team (at) simplywallst.com.
This article by Simply Wall St is general in nature. We provide commentary based on historical data and analyst forecasts only using an unbiased methodology and our articles are not intended to be financial advice. It does not constitute a recommendation to buy or sell any stock, and does not take account of your objectives, or your financial situation. We aim to bring you long-term focused analysis driven by fundamental data. Note that our analysis may not factor in the latest price-sensitive company announcements or qualitative material. Simply Wall St has no position in any stocks mentioned.
About OB:HDLY
Huddly
A technology company, creates tools for team collaboration in Europe, the Middle East, Africa, the Asia Pacific, and the Americas.
Excellent balance sheet with slight risk.
Similar Companies
Market Insights

Advertisement
Community Narratives
MicroVision will explode future revenue by 380.37% with a vision towards success
Fair Value US$60|98.4% undervalued
TH
Community Contributor
The Indispensable Artery for a New North American Economy
Fair Value CA$132.87|1.6% undervalued
TI
Community Contributor
Recently Updated Narratives
BE


Bejgal on MINISO Group Holding ·
MINISO's fair value is projected at 26.69 with an anticipated PE ratio shift of 20x
Fair Value:US$26.6928.0% undervalued
44 followersusers have followed this narrative
3 commentsusers have commented on this narrative
0 likesusers have liked this narrative
TI


TickerTickle on Oracle ·
The Quiet Giant That Became AI’s Power Grid
Fair Value:US$389.8149.5% undervalued
7 followersusers have followed this narrative
1 commentusers have commented on this narrative
0 likesusers have liked this narrative
AU

AuCA on Nova Ljubljanska Banka d.d ·
Nova Ljubljanska Banka d.d will expect a 11.2% revenue boost driving future growth
Fair Value:€20916.3% undervalued
23 followersusers have followed this narrative
3 commentsusers have commented on this narrative
0 likesusers have liked this narrative
Popular Narratives
OS


oscargarcia on Alphabet ·
The company that turned a verb into a global necessity and basically runs the modern internet, digital ads, smartphones, maps, and AI.
Fair Value:US$3404.9% undervalued
134 followersusers have followed this narrative
6 commentsusers have commented on this narrative
18 likesusers have liked this narrative
TH

TheWallstreetKing on MicroVision ·
MicroVision will explode future revenue by 380.37% with a vision towards success
Fair Value:US$6098.4% undervalued
83 followersusers have followed this narrative
11 commentsusers have commented on this narrative
18 likesusers have liked this narrative
AN


AnalystConsensusTarget on NVIDIA ·
NVDA: Expanding AI Demand Will Drive Major Data Center Investments Through 2026
Fair Value:US$232.7923.6% undervalued
924 followersusers have followed this narrative
5 commentsusers have commented on this narrative
22 likesusers have liked this narrative