
Advertisement
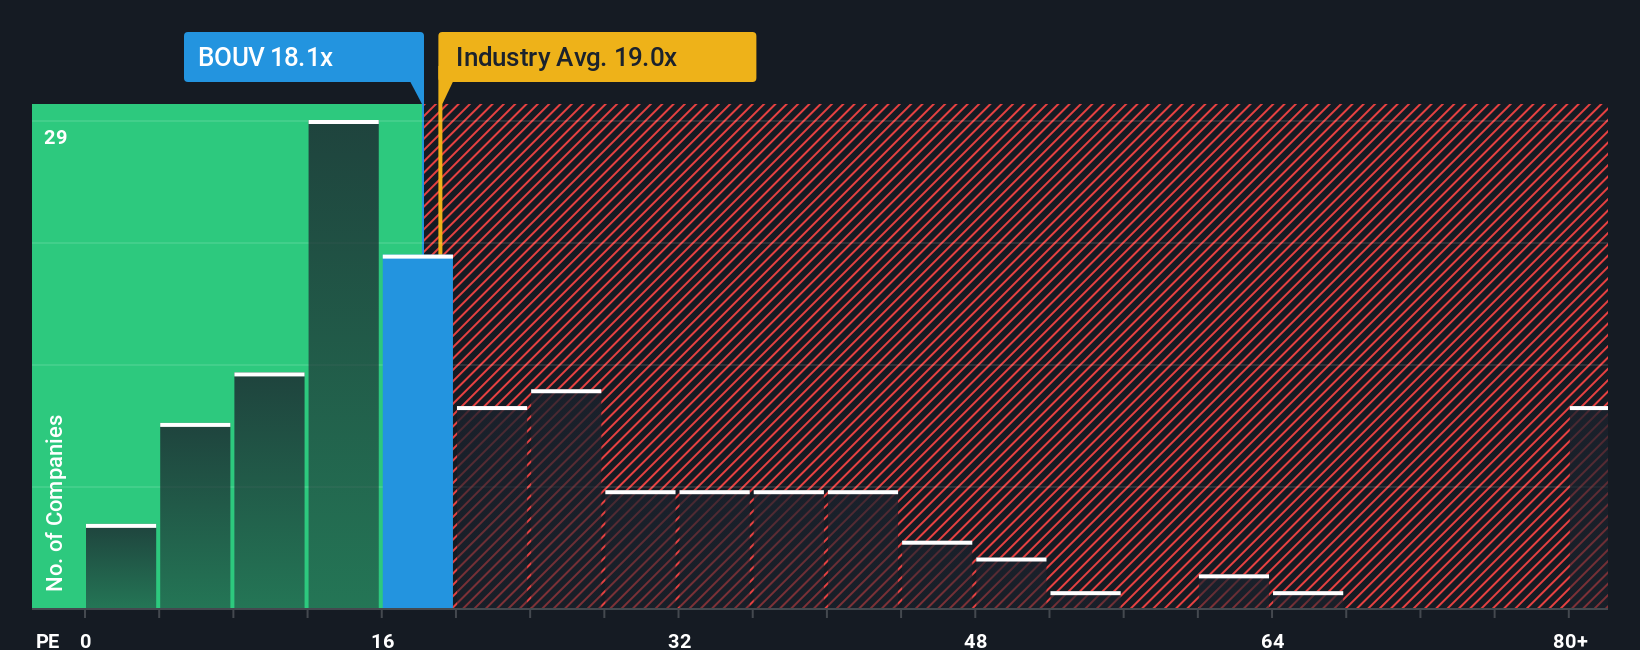
When close to half the companies in Norway have price-to-earnings ratios (or "P/E's") below 12x, you may consider Bouvet ASA (OB:BOUV) as a stock to potentially avoid with its 18.1x P/E ratio. Nonetheless, we'd need to dig a little deeper to determine if there is a rational basis for the elevated P/E.
There hasn't been much to differentiate Bouvet's and the market's earnings growth lately. It might be that many expect the mediocre earnings performance to strengthen positively, which has kept the P/E from falling. You'd really hope so, otherwise you're paying a pretty hefty price for no particular reason.
View our latest analysis for Bouvet
Does Growth Match The High P/E?
In order to justify its P/E ratio, Bouvet would need to produce impressive growth in excess of the market.
Taking a look back first, we see that the company managed to grow earnings per share by a handy 8.2% last year. The latest three year period has also seen an excellent 33% overall rise in EPS, aided somewhat by its short-term performance. Accordingly, shareholders would have probably welcomed those medium-term rates of earnings growth.
Turning to the outlook, the next three years should generate growth of 5.2% per annum as estimated by the sole analyst watching the company. With the market predicted to deliver 20% growth per annum, the company is positioned for a weaker earnings result.
With this information, we find it concerning that Bouvet is trading at a P/E higher than the market. It seems most investors are hoping for a turnaround in the company's business prospects, but the analyst cohort is not so confident this will happen. Only the boldest would assume these prices are sustainable as this level of earnings growth is likely to weigh heavily on the share price eventually.
What We Can Learn From Bouvet's P/E?
Using the price-to-earnings ratio alone to determine if you should sell your stock isn't sensible, however it can be a practical guide to the company's future prospects.
We've established that Bouvet currently trades on a much higher than expected P/E since its forecast growth is lower than the wider market. When we see a weak earnings outlook with slower than market growth, we suspect the share price is at risk of declining, sending the high P/E lower. This places shareholders' investments at significant risk and potential investors in danger of paying an excessive premium.
The company's balance sheet is another key area for risk analysis. You can assess many of the main risks through our free balance sheet analysis for Bouvet with six simple checks.
If these risks are making you reconsider your opinion on Bouvet, explore our interactive list of high quality stocks to get an idea of what else is out there.
Valuation is complex, but we're here to simplify it.
Discover if Bouvet might be undervalued or overvalued with our detailed analysis, featuring fair value estimates, potential risks, dividends, insider trades, and its financial condition.
Access Free AnalysisHave feedback on this article? Concerned about the content? Get in touch with us directly. Alternatively, email editorial-team (at) simplywallst.com.
This article by Simply Wall St is general in nature. We provide commentary based on historical data and analyst forecasts only using an unbiased methodology and our articles are not intended to be financial advice. It does not constitute a recommendation to buy or sell any stock, and does not take account of your objectives, or your financial situation. We aim to bring you long-term focused analysis driven by fundamental data. Note that our analysis may not factor in the latest price-sensitive company announcements or qualitative material. Simply Wall St has no position in any stocks mentioned.
About OB:BOUV
Bouvet
Provides IT and digital communication consultancy services for public and private sectors in Norway, Sweden, and internationally.
Flawless balance sheet, undervalued and pays a dividend.
Similar Companies
Market Insights

Advertisement
Community Narratives
MINISO's fair value is projected at 26.69 with an anticipated PE ratio shift of 20x
Fair Value US$24.03|11.4% undervalued
BE
Community Contributor
Procter & Gamble: A Dividend Giant Facing Slowing Growth
Fair Value US$119.81|23.5% overvalued
AN
Community Contributor
Eli Lilly's Future Growth Driven by Tirzepatide and Favorable Market Conditions
Fair Value US$1.19k|14.0% undervalued
EA
Community Contributor