Advertisement
Assessing Storebrand (OB:STB) Valuation After Strong Q3 Profit and EPS Growth

Simply Wall St
Reviewed by Simply Wall St
Storebrand (OB:STB) caught investor attention after reporting third quarter net income of NOK 1,330 million, up from NOK 1,111 million last year. Earnings per share also saw a year-over-year improvement.
See our latest analysis for Storebrand.
Following its upbeat quarterly report, Storebrand’s share price momentum has gathered pace, with a 5.9% gain over the past three months and an impressive year-to-date share price return of 29.2%. Investors looking at the longer horizon will note the three-year total shareholder return stands at a robust 121%, highlighting steady progress for those who stayed the course.
If Storebrand’s results have you rethinking what’s possible in financial stocks, now is the perfect time to broaden your research and discover fast growing stocks with high insider ownership
But after a substantial rally and near-full alignment with analyst targets, investors are left to wonder: is there still value to be found in Storebrand, or has the market already priced in the company’s future growth?
Most Popular Narrative: 6.5% Overvalued
Storebrand's narrative fair value stands at NOK 147.50, while the last closing price is NOK 157.10. This suggests the market may be placing a premium on its near-term performance. This difference is driving debate among followers about whether expectations for future growth are now too high.
Large investments in share buybacks and dividends, supported by strong cash flow and operational results, indicate anticipated continuous shareholder returns. However, they may also be critiqued as over-leveraging future earnings potential.
Curious what makes this narrative tick? The fair value rests on bold moves in capital allocation and assumes monumental shifts in profit margins and future multiples. Want to see which financial lever has analysts predicting a valuation leap rarely seen in Nordic insurers? The underlying assumptions are anything but standard. Take a closer look to discover the details hidden in the projections.
Result: Fair Value of $147.50 (OVERVALUED)
Have a read of the narrative in full and understand what's behind the forecasts.
However, sustained double-digit growth in key business areas or value-accretive acquisitions could quickly tip the narrative back in Storebrand’s favor.
Find out about the key risks to this Storebrand narrative.
Another View: What Does the SWS DCF Model Say?
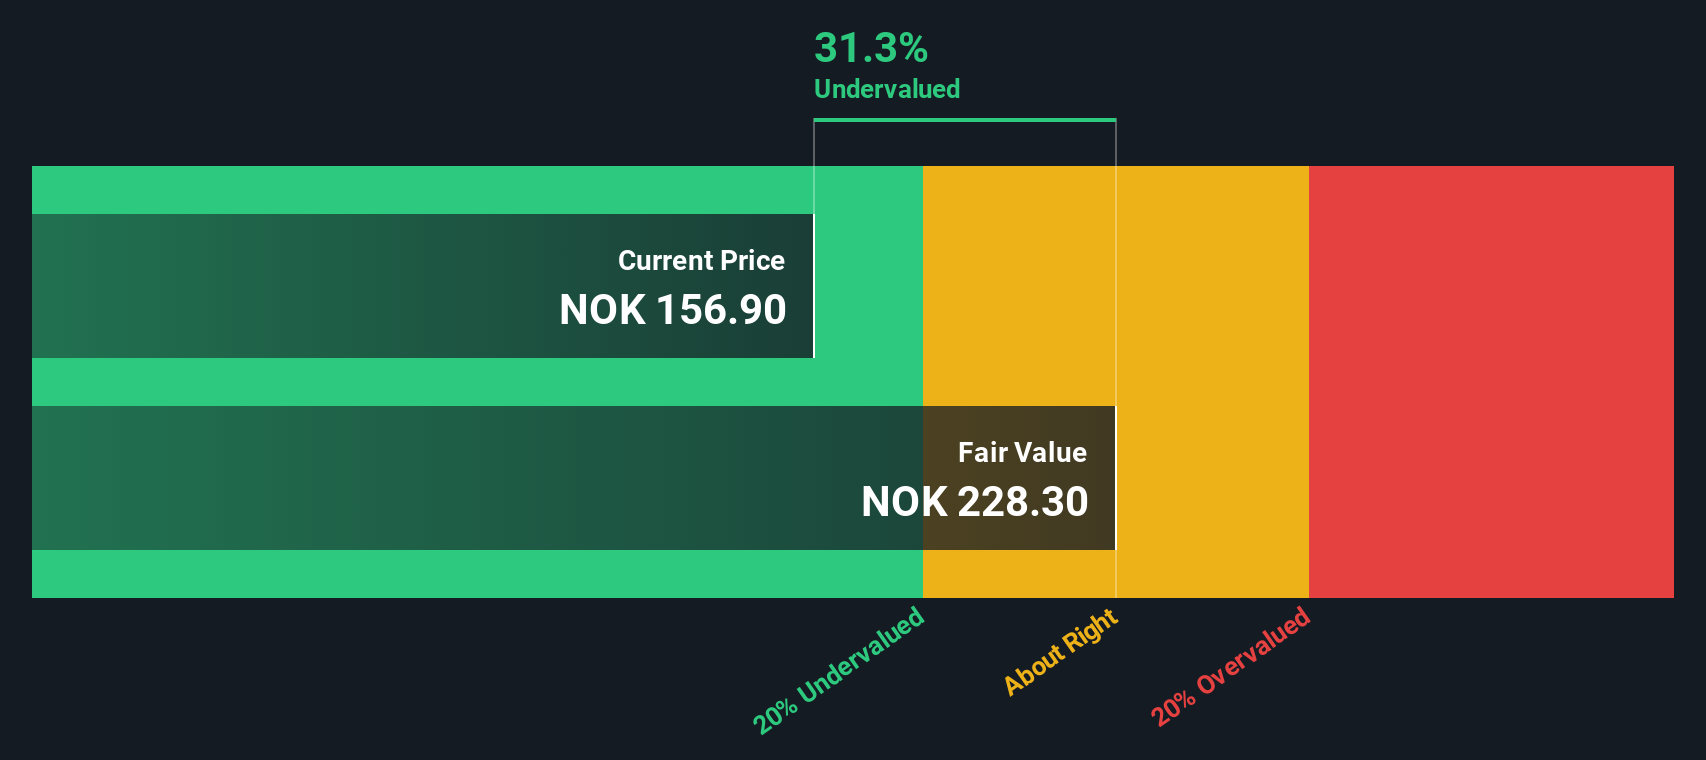
While many focus on analyst price targets, our DCF model values Storebrand at NOK 225.35 per share. This suggests it is trading at a 30% discount to its calculated fair value. This large gap could signal untapped upside, or it could point to risks that analysts have already factored in.
Look into how the SWS DCF model arrives at its fair value.
Simply Wall St performs a discounted cash flow (DCF) on every stock in the world every day (check out Storebrand for example). We show the entire calculation in full. You can track the result in your watchlist or portfolio and be alerted when this changes, or use our stock screener to discover 840 undervalued stocks based on their cash flows. If you save a screener we even alert you when new companies match - so you never miss a potential opportunity.
Build Your Own Storebrand Narrative
If this take on Storebrand does not fully align with your perspective or you would rather dive into the numbers firsthand, you can quickly shape your own story with the data at hand in just a few minutes. Do it your way
A great starting point for your Storebrand research is our analysis highlighting 1 key reward and 1 important warning sign that could impact your investment decision.
Looking for More Investing Ideas?
Smart investors never stop at one stock. Get ahead of the crowd and move confidently with opportunities you will not want to miss, each tailored for forward-thinking portfolios.
- Unlock potential growth by tapping into these 840 undervalued stocks based on cash flows with solid cash flows and overlooked upside.
- Boost your income stream by targeting these 22 dividend stocks with yields > 3%, which offers strong yields for investors seeking reliable returns.
- Ride the wave of innovation and shape your future with these 26 AI penny stocks, which accelerates advances in artificial intelligence.
This article by Simply Wall St is general in nature. We provide commentary based on historical data and analyst forecasts only using an unbiased methodology and our articles are not intended to be financial advice. It does not constitute a recommendation to buy or sell any stock, and does not take account of your objectives, or your financial situation. We aim to bring you long-term focused analysis driven by fundamental data. Note that our analysis may not factor in the latest price-sensitive company announcements or qualitative material. Simply Wall St has no position in any stocks mentioned.
New: Manage All Your Stock Portfolios in One Place
We've created the ultimate portfolio companion for stock investors, and it's free.
• Connect an unlimited number of Portfolios and see your total in one currency
• Be alerted to new Warning Signs or Risks via email or mobile
• Track the Fair Value of your stocks
Have feedback on this article? Concerned about the content? Get in touch with us directly. Alternatively, email editorial-team@simplywallst.com
About OB:STB
Storebrand
Provides insurance products and services in Norway, Sweden, the United Kingdom, Finland, Denmark, Germany, Luxemburg, and Ireland.
Good value with acceptable track record.
Similar Companies
Market Insights

Advertisement
Community Narratives
The company that turned a verb into a global necessity and basically runs the modern internet, digital ads, smartphones, maps, and AI.
Fair Value US$300.00|6.3% undervalued
OS
Community Contributor
Flowers Foods Pays A Fair Price For Health
Fair Value US$16.12|26.0% undervalued
NV
Community Contributor
TMX Group will thrive with 33.3% profit margin and enduring market moat
Fair Value CA$49.90|3.7% overvalued
LI
Community Contributor