- Norway
- /
- Oil and Gas
- /
- OB:SEAPT
Take Care Before Jumping Onto Seacrest Petroleo Bermuda Limited (OB:SEAPT) Even Though It's 43% Cheaper

To the annoyance of some shareholders, Seacrest Petroleo Bermuda Limited (OB:SEAPT) shares are down a considerable 43% in the last month, which continues a horrid run for the company. The recent drop completes a disastrous twelve months for shareholders, who are sitting on a 67% loss during that time.
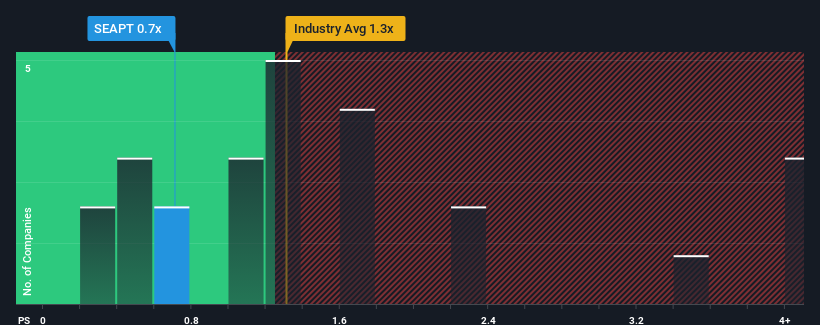
After such a large drop in price, when close to half the companies operating in Norway's Oil and Gas industry have price-to-sales ratios (or "P/S") above 1.3x, you may consider Seacrest Petroleo Bermuda as an enticing stock to check out with its 0.7x P/S ratio. Nonetheless, we'd need to dig a little deeper to determine if there is a rational basis for the reduced P/S.
View our latest analysis for Seacrest Petroleo Bermuda

What Does Seacrest Petroleo Bermuda's P/S Mean For Shareholders?
Recent times have been pleasing for Seacrest Petroleo Bermuda as its revenue has risen in spite of the industry's average revenue going into reverse. One possibility is that the P/S ratio is low because investors think the company's revenue is going to fall away like everyone else's soon. If not, then existing shareholders have reason to be quite optimistic about the future direction of the share price.
Want the full picture on analyst estimates for the company? Then our free report on Seacrest Petroleo Bermuda will help you uncover what's on the horizon.Is There Any Revenue Growth Forecasted For Seacrest Petroleo Bermuda?
There's an inherent assumption that a company should underperform the industry for P/S ratios like Seacrest Petroleo Bermuda's to be considered reasonable.
Taking a look back first, we see that the company's revenues underwent some rampant growth over the last 12 months. In spite of this unbelievable short-term growth, the latest three year period hasn't been as great in aggregate as it didn't manage to provide any growth at all. So it appears to us that the company has had a mixed result in terms of growing revenue over that time.
Looking ahead now, revenue is anticipated to remain buoyant, climbing by 42% per year during the coming three years according to the three analysts following the company. That would be an excellent outcome when the industry is expected to decline by 0.6% per annum.
With this in mind, we find it intriguing that Seacrest Petroleo Bermuda's P/S falls short of its industry peers. Apparently some shareholders are doubtful of the contrarian forecasts and have been accepting significantly lower selling prices.
The Bottom Line On Seacrest Petroleo Bermuda's P/S
Seacrest Petroleo Bermuda's recently weak share price has pulled its P/S back below other Oil and Gas companies. While the price-to-sales ratio shouldn't be the defining factor in whether you buy a stock or not, it's quite a capable barometer of revenue expectations.
Our look into Seacrest Petroleo Bermuda's analyst forecasts has shown that it could be trading at a significant discount in terms of P/S, as it is expected to far outperform the industry. When we see a superior revenue outlook with some actual growth, we can only assume investor uncertainty is what's been suppressing the P/S figures. Amidst challenging industry conditions, a key concern is whether the company can sustain its superior revenue growth trajectory. So, the risk of a price drop looks to be subdued, but investors seem to think future revenue could see a lot of volatility.
Before you take the next step, you should know about the 3 warning signs for Seacrest Petroleo Bermuda (1 is a bit unpleasant!) that we have uncovered.
If these risks are making you reconsider your opinion on Seacrest Petroleo Bermuda, explore our interactive list of high quality stocks to get an idea of what else is out there.
New: Manage All Your Stock Portfolios in One Place
We've created the ultimate portfolio companion for stock investors, and it's free.
• Connect an unlimited number of Portfolios and see your total in one currency
• Be alerted to new Warning Signs or Risks via email or mobile
• Track the Fair Value of your stocks
Have feedback on this article? Concerned about the content? Get in touch with us directly. Alternatively, email editorial-team (at) simplywallst.com.
This article by Simply Wall St is general in nature. We provide commentary based on historical data and analyst forecasts only using an unbiased methodology and our articles are not intended to be financial advice. It does not constitute a recommendation to buy or sell any stock, and does not take account of your objectives, or your financial situation. We aim to bring you long-term focused analysis driven by fundamental data. Note that our analysis may not factor in the latest price-sensitive company announcements or qualitative material. Simply Wall St has no position in any stocks mentioned.
About OB:SEAPT
Seacrest Petroleo Bermuda
An independent oil and gas production company, engages in the redevelopment of midlife onshore producing oil and gas fields in Brazil.
High growth potential slight.
Market Insights
Community Narratives


