

PGS ASA's (OB:PGS) recent earnings report didn't offer any surprises, with the shares unchanged over the last week. Our analysis suggests that shareholders might be missing some positive underlying factors in the earnings report.
View our latest analysis for PGS
Examining Cashflow Against PGS' Earnings
As finance nerds would already know, the accrual ratio from cashflow is a key measure for assessing how well a company's free cash flow (FCF) matches its profit. To get the accrual ratio we first subtract FCF from profit for a period, and then divide that number by the average operating assets for the period. The ratio shows us how much a company's profit exceeds its FCF.
As a result, a negative accrual ratio is a positive for the company, and a positive accrual ratio is a negative. While having an accrual ratio above zero is of little concern, we do think it's worth noting when a company has a relatively high accrual ratio. To quote a 2014 paper by Lewellen and Resutek, "firms with higher accruals tend to be less profitable in the future".
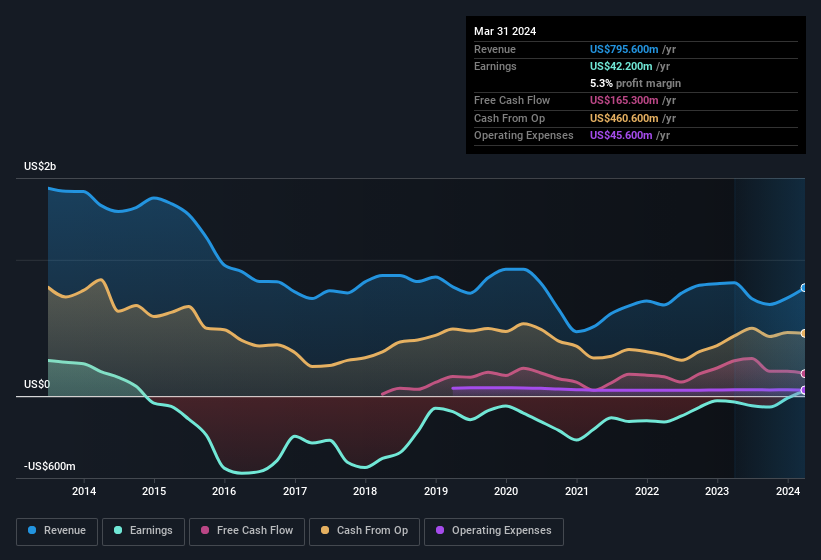
Over the twelve months to March 2024, PGS recorded an accrual ratio of -0.12. Therefore, its statutory earnings were quite a lot less than its free cashflow. In fact, it had free cash flow of US$165m in the last year, which was a lot more than its statutory profit of US$42.2m. PGS' free cash flow actually declined over the last year, which is disappointing, like non-biodegradable balloons. Having said that, there is more to the story. The accrual ratio is reflecting the impact of unusual items on statutory profit, at least in part.
That might leave you wondering what analysts are forecasting in terms of future profitability. Luckily, you can click here to see an interactive graph depicting future profitability, based on their estimates.
How Do Unusual Items Influence Profit?
PGS' profit was reduced by unusual items worth US$78m in the last twelve months, and this helped it produce high cash conversion, as reflected by its unusual items. In a scenario where those unusual items included non-cash charges, we'd expect to see a strong accrual ratio, which is exactly what has happened in this case. It's never great to see unusual items costing the company profits, but on the upside, things might improve sooner rather than later. We looked at thousands of listed companies and found that unusual items are very often one-off in nature. And, after all, that's exactly what the accounting terminology implies. If PGS doesn't see those unusual expenses repeat, then all else being equal we'd expect its profit to increase over the coming year.
Our Take On PGS' Profit Performance
In conclusion, both PGS' accrual ratio and its unusual items suggest that its statutory earnings are probably reasonably conservative. Looking at all these factors, we'd say that PGS' underlying earnings power is at least as good as the statutory numbers would make it seem. With this in mind, we wouldn't consider investing in a stock unless we had a thorough understanding of the risks. Be aware that PGS is showing 3 warning signs in our investment analysis and 1 of those is a bit unpleasant...
After our examination into the nature of PGS' profit, we've come away optimistic for the company. But there is always more to discover if you are capable of focussing your mind on minutiae. For example, many people consider a high return on equity as an indication of favorable business economics, while others like to 'follow the money' and search out stocks that insiders are buying. While it might take a little research on your behalf, you may find this free collection of companies boasting high return on equity, or this list of stocks with significant insider holdings to be useful.
If you're looking to trade PGS, open an account with the lowest-cost platform trusted by professionals, Interactive Brokers.
With clients in over 200 countries and territories, and access to 160 markets, IBKR lets you trade stocks, options, futures, forex, bonds and funds from a single integrated account.
Enjoy no hidden fees, no account minimums, and FX conversion rates as low as 0.03%, far better than what most brokers offer.
Sponsored ContentNew: Manage All Your Stock Portfolios in One Place
We've created the ultimate portfolio companion for stock investors, and it's free.
• Connect an unlimited number of Portfolios and see your total in one currency
• Be alerted to new Warning Signs or Risks via email or mobile
• Track the Fair Value of your stocks
Have feedback on this article? Concerned about the content? Get in touch with us directly. Alternatively, email editorial-team (at) simplywallst.com.
This article by Simply Wall St is general in nature. We provide commentary based on historical data and analyst forecasts only using an unbiased methodology and our articles are not intended to be financial advice. It does not constitute a recommendation to buy or sell any stock, and does not take account of your objectives, or your financial situation. We aim to bring you long-term focused analysis driven by fundamental data. Note that our analysis may not factor in the latest price-sensitive company announcements or qualitative material. Simply Wall St has no position in any stocks mentioned.
About OB:PGS
PGS
Operates as a marine geophysical company in Norway and internationally.
Reasonable growth potential and fair value.
Similar Companies
Market Insights

Community Narratives

