
Advertisement
- Norway
- /
- Energy Services
- /
- OB:ODL
Is Odfjell Drilling Ltd.'s (OB:ODL) High P/E Ratio A Problem For Investors?
The goal of this article is to teach you how to use price to earnings ratios (P/E ratios). We'll show how you can use Odfjell Drilling Ltd.'s (OB:ODL) P/E ratio to inform your assessment of the investment opportunity. What is Odfjell Drilling's P/E ratio? Well, based on the last twelve months it is 18.18. That means that at current prices, buyers pay NOK18.18 for every NOK1 in trailing yearly profits.
Check out our latest analysis for Odfjell Drilling
How Do You Calculate A P/E Ratio?
The formula for P/E is:
Price to Earnings Ratio = Price per Share (in the reporting currency) ÷ Earnings per Share (EPS)
Or for Odfjell Drilling:
P/E of 18.18 = $2.96 (Note: this is the share price in the reporting currency, namely, USD ) ÷ $0.16 (Based on the year to March 2019.)
Is A High Price-to-Earnings Ratio Good?
A higher P/E ratio implies that investors pay a higher price for the earning power of the business. That isn't necessarily good or bad, but a high P/E implies relatively high expectations of what a company can achieve in the future.
Does Odfjell Drilling Have A Relatively High Or Low P/E For Its Industry?
The P/E ratio essentially measures market expectations of a company. The image below shows that Odfjell Drilling has a P/E ratio that is roughly in line with the energy services industry average (18.2).
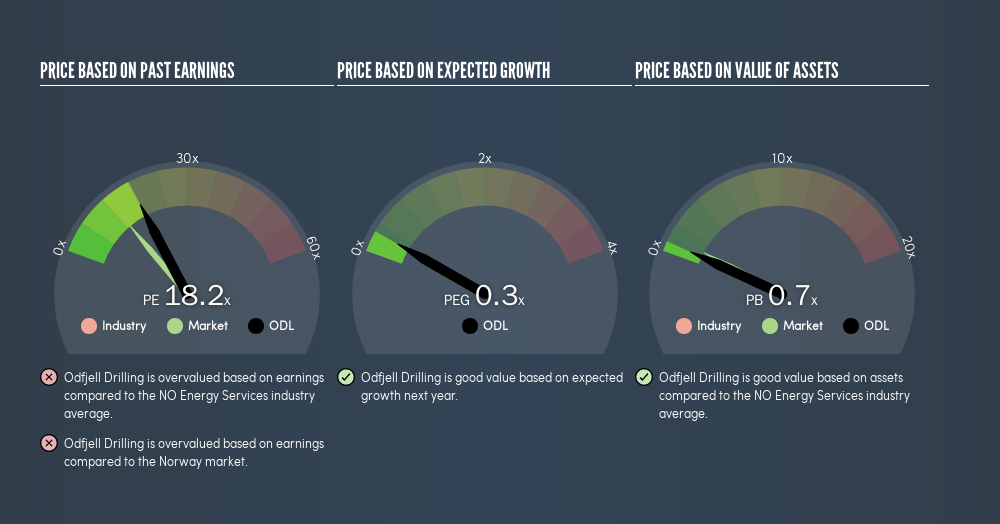
That indicates that the market expects Odfjell Drilling will perform roughly in line with other companies in its industry.
How Growth Rates Impact P/E Ratios
P/E ratios primarily reflect market expectations around earnings growth rates. That's because companies that grow earnings per share quickly will rapidly increase the 'E' in the equation. That means even if the current P/E is high, it will reduce over time if the share price stays flat. And as that P/E ratio drops, the company will look cheap, unless its share price increases.
Odfjell Drilling shrunk earnings per share by 8.9% last year. And over the longer term (5 years) earnings per share have decreased 14% annually. So we might expect a relatively low P/E.
Remember: P/E Ratios Don't Consider The Balance Sheet
The 'Price' in P/E reflects the market capitalization of the company. Thus, the metric does not reflect cash or debt held by the company. In theory, a company can lower its future P/E ratio by using cash or debt to invest in growth.
Such expenditure might be good or bad, in the long term, but the point here is that the balance sheet is not reflected by this ratio.
So What Does Odfjell Drilling's Balance Sheet Tell Us?
Odfjell Drilling's net debt is considerable, at 179% of its market cap. If you want to compare its P/E ratio to other companies, you must keep in mind that these debt levels would usually warrant a relatively low P/E.
The Bottom Line On Odfjell Drilling's P/E Ratio
Odfjell Drilling has a P/E of 18.2. That's higher than the average in its market, which is 13.2. With meaningful debt and a lack of recent earnings growth, the market has high expectations that the business will earn more in the future.
Investors should be looking to buy stocks that the market is wrong about. If the reality for a company is better than it expects, you can make money by buying and holding for the long term. So this free report on the analyst consensus forecasts could help you make a master move on this stock.
Of course you might be able to find a better stock than Odfjell Drilling. So you may wish to see this free collection of other companies that have grown earnings strongly.
We aim to bring you long-term focused research analysis driven by fundamental data. Note that our analysis may not factor in the latest price-sensitive company announcements or qualitative material.
If you spot an error that warrants correction, please contact the editor at editorial-team@simplywallst.com. This article by Simply Wall St is general in nature. It does not constitute a recommendation to buy or sell any stock, and does not take account of your objectives, or your financial situation. Simply Wall St has no position in the stocks mentioned. Thank you for reading.
About OB:ODL
Odfjell Drilling
Engages in owning and operating mobile offshore drilling units primarily in Norway and Namibia.
Reasonable growth potential with mediocre balance sheet.
Similar Companies
Market Insights


Advertisement
Community Narratives
For the Emperor: Why Games Workshop Could Be a Star Investment
Fair Value UK£160.00|0.4% undervalued
RO
Community Contributor
Securitas will boost margins with AI and tech-driven services
Fair Value SEK 260.91|45.0% undervalued
UN
Community Contributor
A Leader in EV Charging with Growth Potential
Fair Value €27.00|20.4% undervalued
TI
Community Contributor