
Advertisement

Want to participate in a short research study? Help shape the future of investing tools and you could win a $250 gift card!
Today we will run through one way of estimating the intrinsic value of North Energy ASA (OB:NORTH) by projecting its future cash flows and then discounting them to today's value. I will be using the Discounted Cash Flow (DCF) model. It may sound complicated, but actually it is quite simple!
Remember though, that there are many ways to estimate a company's value, and a DCF is just one method. Anyone interested in learning a bit more about intrinsic value should have a read of the Simply Wall St analysis model.
View our latest analysis for North Energy
Is North Energy fairly valued?
We are going to use a two-stage DCF model, which, as the name states, takes into account two stages of growth. The first stage is generally a higher growth period which levels off heading towards the terminal value, captured in the second 'steady growth' period. In the first stage we need to estimate the cash flows to the business over the next ten years. Seeing as no analyst estimates of free cash flow are available to us, we have extrapolate the previous free cash flow (FCF) from the company's last reported value. We assume companies with shrinking free cash flow will slow their rate of shrinkage, and that companies with growing free cash flow will see their growth rate slow, over this period. We do this to reflect that growth tends to slow more in the early years than it does in later years.
Generally we assume that a dollar today is more valuable than a dollar in the future, and so the sum of these future cash flows is then discounted to today's value:
10-year free cash flow (FCF) forecast
| 2019 | 2020 | 2021 | 2022 | 2023 | 2024 | 2025 | 2026 | 2027 | 2028 | |
| Levered FCF (NOK, Millions) | NOK8.75 | NOK9.33 | NOK9.81 | NOK10.22 | NOK10.57 | NOK10.88 | NOK11.16 | NOK11.42 | NOK11.67 | NOK11.91 |
| Growth Rate Estimate Source | Est @ 8.75% | Est @ 6.65% | Est @ 5.18% | Est @ 4.16% | Est @ 3.44% | Est @ 2.93% | Est @ 2.58% | Est @ 2.34% | Est @ 2.16% | Est @ 2.04% |
| Present Value (NOK, Millions) Discounted @ 7.78% | NOK8.11 | NOK8.03 | NOK7.84 | NOK7.57 | NOK7.27 | NOK6.94 | NOK6.61 | NOK6.27 | NOK5.94 | NOK5.63 |
Present Value of 10-year Cash Flow (PVCF)= NOK70.21m
"Est" = FCF growth rate estimated by Simply Wall St
We now need to calculate the Terminal Value, which accounts for all the future cash flows after this ten year period. For a number of reasons a very conservative growth rate is used that cannot exceed that of a country's GDP growth. In this case we have used the 10-year government bond rate (1.8%) to estimate future growth. In the same way as with the 10-year 'growth' period, we discount future cash flows to today's value, using a cost of equity of 7.8%.
Terminal Value (TV) = FCF2029 × (1 + g) ÷ (r – g) = øre12m × (1 + 1.8%) ÷ (7.8% – 1.8%) = øre201m
Present Value of Terminal Value (PVTV) = TV / (1 + r)10 = NOKøre201m ÷ ( 1 + 7.8%)10 = NOK95.13m
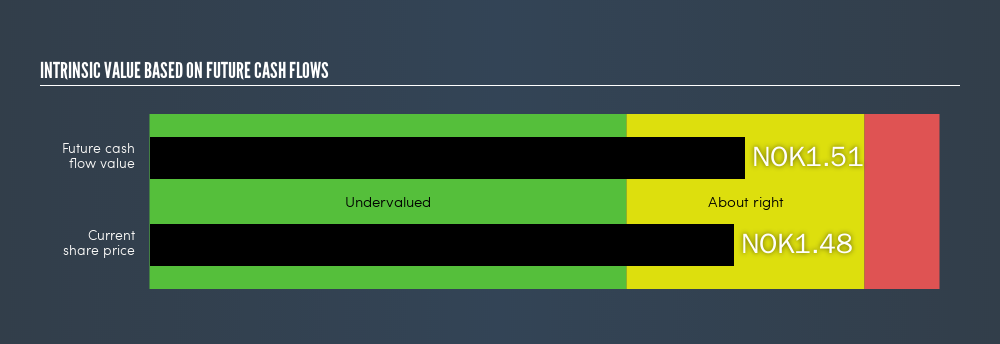
The total value is the sum of cash flows for the next ten years plus the discounted terminal value, which results in the Total Equity Value, which in this case is NOK165.33m. The last step is to then divide the equity value by the number of shares outstanding. This results in an intrinsic value estimate of NOK1.51. Compared to the current share price of NOK1.48, the company appears about fair value at a 1.9% discount to where the stock price trades currently. Valuations are imprecise instruments though, rather like a telescope - move a few degrees and end up in a different galaxy. Do keep this in mind.
Important assumptions
Now the most important inputs to a discounted cash flow are the discount rate, and of course, the actual cash flows. If you don't agree with these result, have a go at the calculation yourself and play with the assumptions. The DCF also does not consider the possible cyclicality of an industry, or a company's future capital requirements, so it does not give a full picture of a company's potential performance. Given that we are looking at North Energy as potential shareholders, the cost of equity is used as the discount rate, rather than the cost of capital (or weighted average cost of capital, WACC) which accounts for debt. In this calculation we've used 7.8%, which is based on a levered beta of 1.01. Beta is a measure of a stock's volatility, compared to the market as a whole. We get our beta from the industry average beta of globally comparable companies, with an imposed limit between 0.8 and 2.0, which is a reasonable range for a stable business.
Next Steps:
Although the valuation of a company is important, it shouldn’t be the only metric you look at when researching a company. The DCF model is not a perfect stock valuation tool. Rather it should be seen as a guide to "what assumptions need to be true for this stock to be under/overvalued?" If a company grows at a different rate, or if its cost of equity or risk free rate changes sharply, the output can look very different. For North Energy, I've compiled three relevant aspects you should further examine:
- Financial Health: Does NORTH have a healthy balance sheet? Take a look at our free balance sheet analysis with six simple checks on key factors like leverage and risk.
- Other High Quality Alternatives: Are there other high quality stocks you could be holding instead of NORTH? Explore our interactive list of high quality stocks to get an idea of what else is out there you may be missing!
PS. The Simply Wall St app conducts a discounted cash flow valuation for every stock on the OB every day. If you want to find the calculation for other stocks just search here.
We aim to bring you long-term focused research analysis driven by fundamental data. Note that our analysis may not factor in the latest price-sensitive company announcements or qualitative material.
If you spot an error that warrants correction, please contact the editor at editorial-team@simplywallst.com. This article by Simply Wall St is general in nature. It does not constitute a recommendation to buy or sell any stock, and does not take account of your objectives, or your financial situation. Simply Wall St has no position in the stocks mentioned. Thank you for reading.
About OB:NORTH
North Energy
An industrial investment company, owns, manages, and provides financing for activities within the energy and other industries in Norway.
Slight with acceptable track record.
Market Insights


Advertisement
Community Narratives
Suncorp’s Next Chapter: Insurance-Only and Ready to Grow
Fair Value AU$22.83|5.7% undervalued
RO
Community Contributor
Thyssenkrupp Nucera Will Achieve Double-Digit Profits by 2030 Boosted by Hydrogen Growth
Fair Value €14.40|31.6% undervalued
CH
Community Contributor
Tesla’s Nvidia Moment – The AI & Robotics Inflection Point
Fair Value US$384.84|18.0% undervalued
BL
Community Contributor